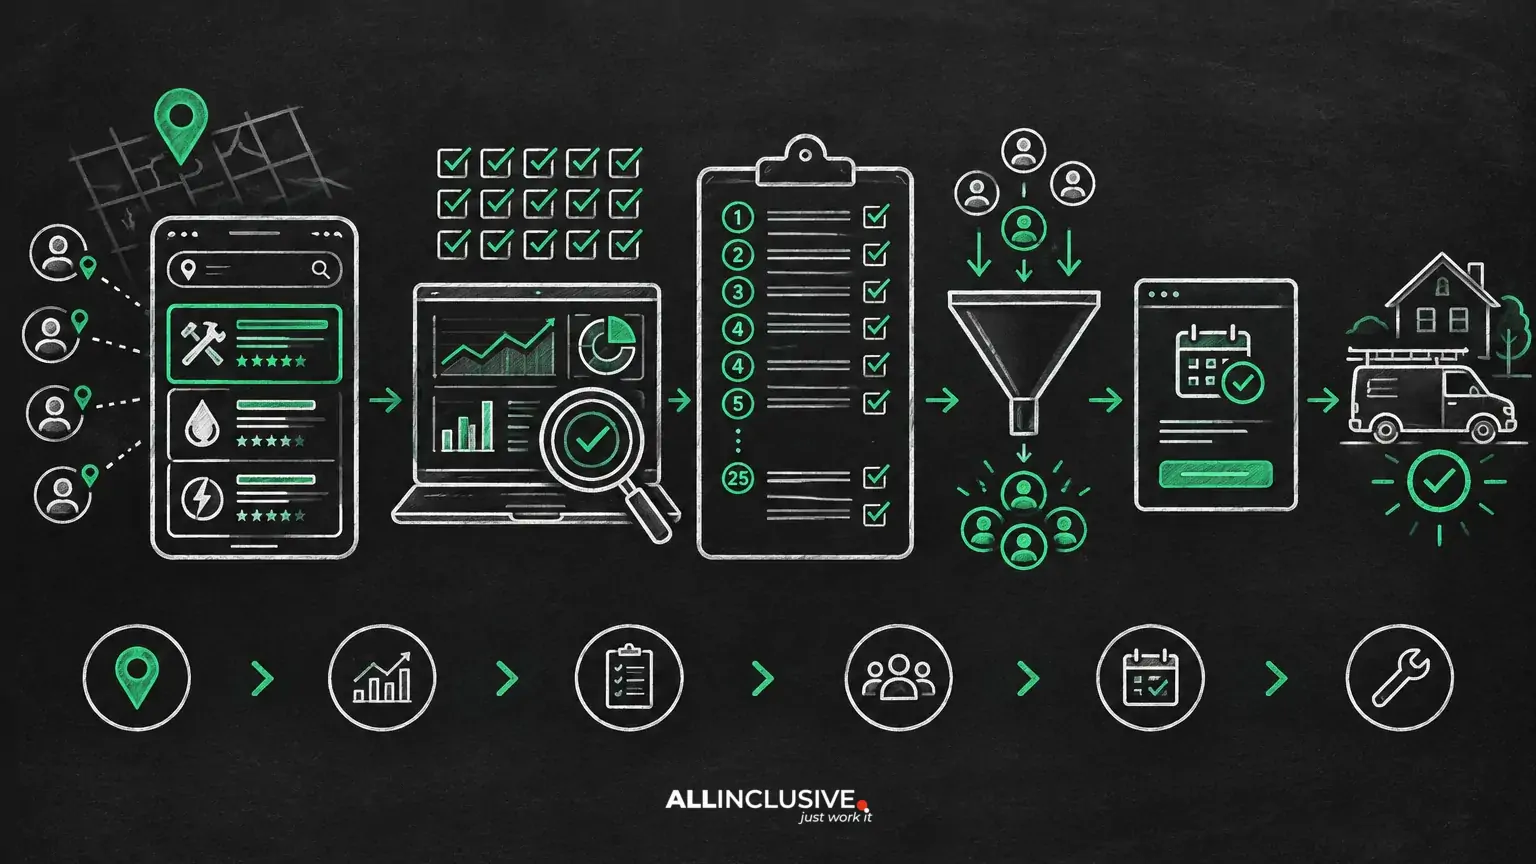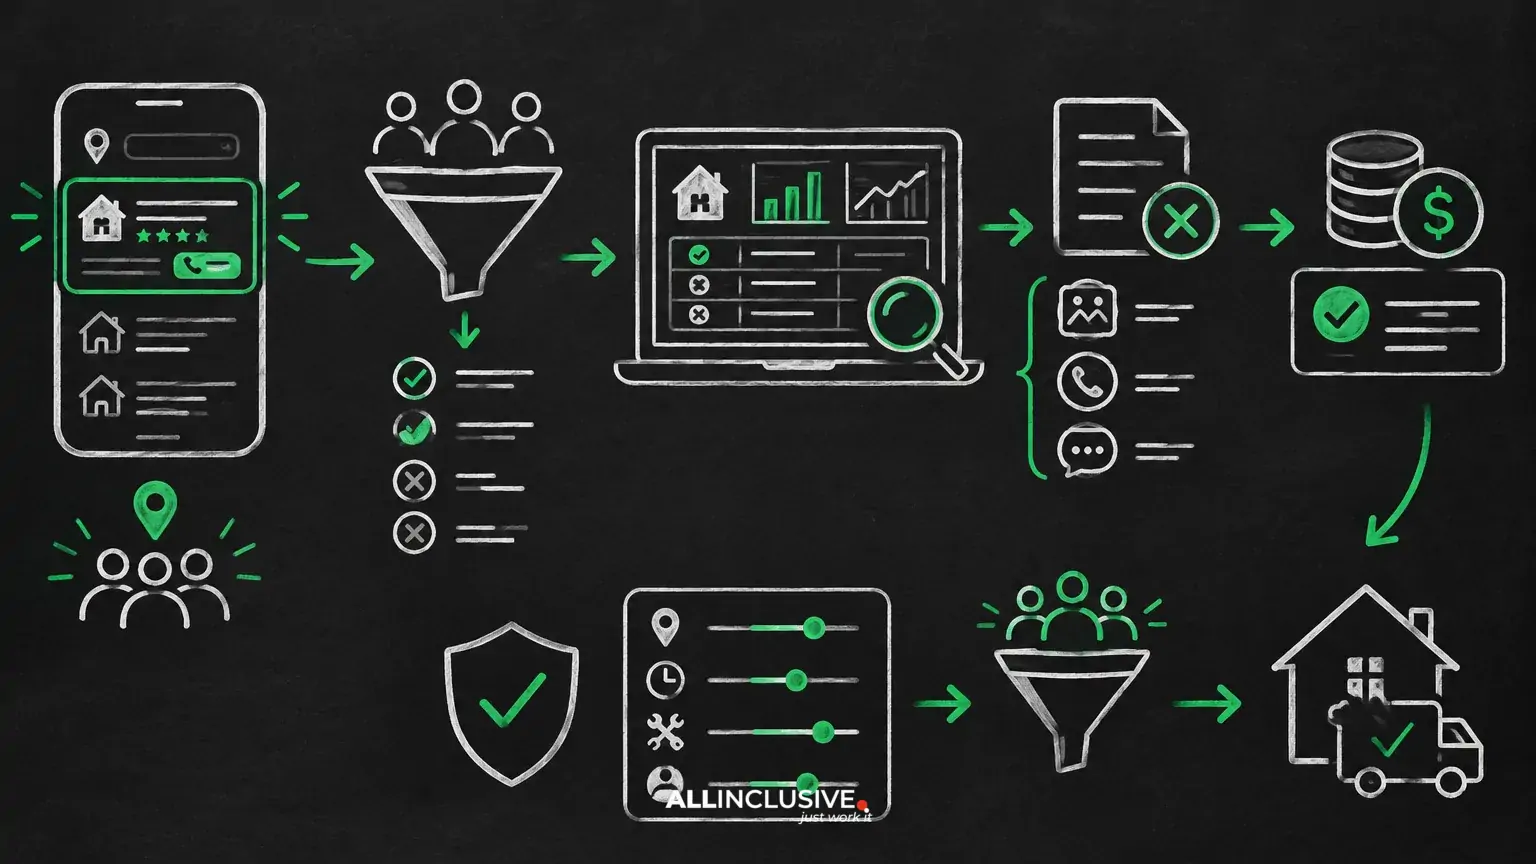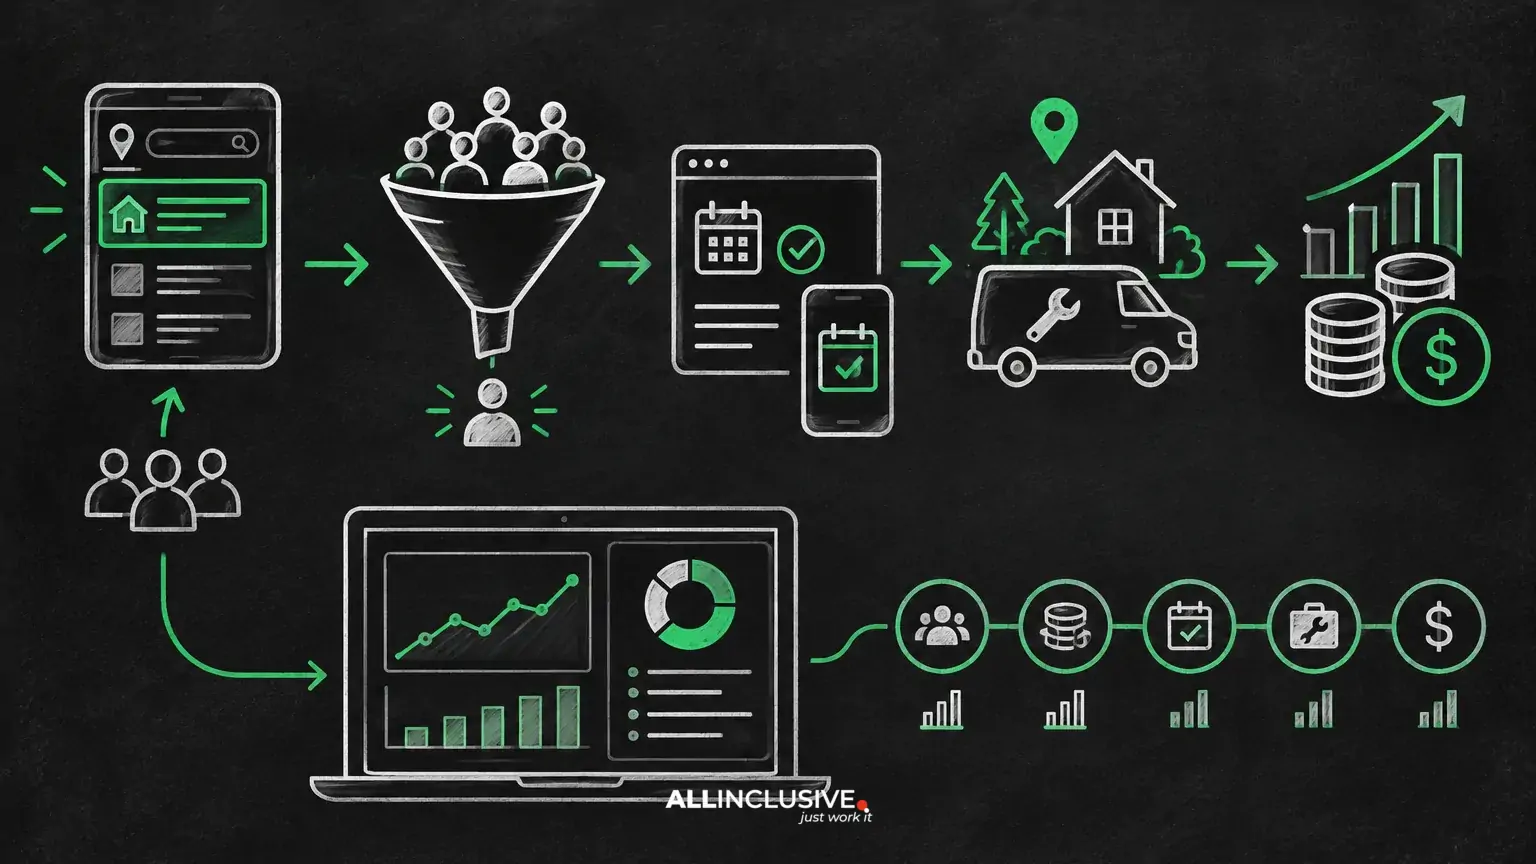
Local Services Ads reporting should answer more than “How many leads did we receive?” A useful report shows how much you spent, which leads became conversations and bookings, what those jobs were worth, and where follow-up or lead quality is limiting growth.
The most reliable approach is to connect platform-level data with operational outcomes. Local Services Ads can help explain lead generation and spend, while your CRM, call-tracking system, booking software or finance records are usually needed to measure response, booked work and revenue. Treat the report as a decision system—not just a monthly export.
What Local Services Ads reporting should measure
A practical reporting framework has four layers:
- Delivery: impressions or visibility indicators available in the platform, leads and spend.
- Lead quality: service fit, location fit, urgency, duplicate status and whether the contact is reachable.
- Sales progression: response, qualified conversations, booked appointments, estimates and completed jobs.
- Business value: revenue, gross margin where available, customer value and return on advertising spend.
Not every business can capture every field immediately. Start with a consistent lead ID, date, service type, source, outcome and spend. Add booking and revenue fields as the operating process matures.
The core Local Services Ads metrics
Leads and cost
Lead volume is a useful activity measure, but it is not a performance verdict. A high number of contacts can conceal poor service fit, missed calls, duplicate enquiries or low conversion after the first conversation.
Track total leads alongside advertising spend and calculate cost per lead:
Cost per lead = advertising spend ÷ leads
Use a consistent definition of “lead.” If the platform includes calls, messages or other contact types, separate them where possible. A call that reaches the business is operationally different from a missed call or an enquiry that cannot be verified.
Qualified lead rate
Define a qualified lead around business criteria, such as the correct service, serviceable location, customer need and realistic timing. Then calculate:
Qualified lead rate = qualified leads ÷ total leads
This metric helps distinguish media efficiency from market or operational fit. If cost per lead falls while qualified lead rate also falls, the account may be generating cheaper but less useful demand.
Booking rate
Booking rate measures whether qualified opportunities become scheduled work. Depending on the business model, the denominator may be qualified leads, answered conversations or estimates issued. Choose one definition and label it clearly.
Booking rate = booked jobs or appointments ÷ defined lead population
Keep different booking stages separate. An appointment booked, an estimate accepted and a job completed are not interchangeable outcomes. For a deeper operational view, see Local Services Ads Booking Rate: How to Turn More Leads Into Jobs.
Cost per booked job
Cost per booked job is often more actionable than cost per lead:
Cost per booked job = advertising spend ÷ booked jobs
This metric incorporates both media cost and the business’s ability to convert enquiries. It can rise even when the platform is stable if calls are missed, response is slow or appointment availability is limited.
Revenue and return
Where job values are available, report booked revenue and completed revenue separately. Booked revenue reflects expected value; completed revenue is closer to realized value but may arrive weeks or months after the lead.
Return on ad spend = attributed revenue ÷ advertising spend
Revenue attribution needs a defined rule. For example, assign revenue to the original lead source when the contact is unique and the job can be matched to a recorded enquiry. If a customer uses multiple channels before booking, document whether the report uses first-touch, last-touch or another agreed approach.
Build a reporting dataset before building a dashboard
A dashboard cannot repair inconsistent source data. Create a lead-level table with one row per enquiry or contact. Useful fields include:
- Lead date and time
- Contact type, such as call or message
- Campaign or listing context, when available
- Service requested
- Location or service area
- New, duplicate, spam or existing-customer status
- Qualified, unqualified, unreachable or disputed outcome
- First response time
- Appointment, estimate and completed-job status
- Booked and realized revenue
- Reason for loss or cancellation
Use controlled values instead of free-text labels wherever possible. “Wrong service,” “outside area” and “not our service” should not become three unrelated categories if they represent the same reporting decision.
Reconcile platform data with business records
Start each reporting period by reconciling the platform’s lead and spend totals with your internal records. Differences are not automatically errors: time zones, reporting windows, duplicate contacts, delayed entries and differing lead definitions can all create variance.
Document three rules:
- Date rule: decide whether reporting uses lead date, booking date, job date or payment date for each metric.
- Identity rule: define how calls, messages and repeat contacts are matched to one customer or job.
- Attribution rule: state how revenue is assigned when more than one marketing touchpoint is involved.
Keep these rules stable during a comparison period. Changing definitions halfway through a month can make a chart look better or worse without changing actual performance.
Separate lead quality from lead disputes
A lead may be commercially poor without meeting the criteria for a platform dispute or credit. Reporting should therefore maintain separate fields for business quality and platform review status.
For each unsuitable contact, record the operational reason first: wrong service, outside territory, duplicate, spam, unreachable, price shopper or another defined category. Then record whether it was submitted for review and the final outcome. This preserves a complete view of demand quality rather than treating credits as a substitute for performance analysis.
For more detail on this distinction, read Local Services Ads Lead Disputes and Credits: What Businesses Should Know.
Use cohorts to avoid misleading averages
Monthly averages can hide important differences. Break reporting into useful cohorts such as service type, location, day of week, contact type and customer status. A plumbing emergency, a planned installation and a recurring maintenance enquiry may have very different booking cycles and values.
Compare cohorts only when the sample and definitions are reasonably consistent. Avoid declaring a winner from a small group of leads. Instead, use the finding as a question for the next review: does this service attract better-fit demand, receive faster follow-up or produce higher-value jobs?
Connect response time to booking outcomes
Media reporting and operational reporting should meet at the lead level. Add first-response time and disposition to the dataset, then compare outcomes for leads reached promptly versus leads reached later. Do not assume a universal response-time threshold; customer urgency, opening hours and service type matter.
Useful questions include:
- What share of leads receives a documented first response?
- How many calls are missed during business hours?
- Which lead types remain unanswered or unqualified?
- Does booking performance differ by response interval?
The objective is not to blame the channel for an operations problem. It is to identify where additional media spend would be wasted unless capacity, routing or follow-up improves. See Local Services Ads Response Time: Why Speed Matters for Lead Value for a focused treatment of this issue.
A reporting cadence that supports decisions
Weekly operating review
Review new leads, unanswered contacts, qualification outcomes, booking progression and urgent data issues. The weekly meeting should produce actions, such as correcting service categories, improving call handling or resolving missing CRM statuses.
Monthly performance review
Compare spend, leads, qualified rate, booking rate, cost per booked job and revenue by relevant cohort. Explain material changes using evidence from the lead table rather than relying on a single top-line metric.
Quarterly planning review
Assess whether the current service mix, operating capacity and revenue model support further investment. Review completed-job value, repeat-customer effects, seasonality and measurement gaps. A quarterly view is especially important when jobs close well after the original lead.
Common reporting mistakes
- Optimizing for lead volume alone: more contacts do not necessarily mean more profitable work.
- Mixing booked and completed revenue: these stages carry different levels of certainty.
- Ignoring missed calls: an unhandled enquiry should not be interpreted as evidence of weak demand.
- Changing definitions frequently: unstable labels make trend analysis unreliable.
- Reporting only blended averages: service and location differences can disappear inside one number.
- Treating platform metrics as financial truth: internal job and payment records are usually needed for revenue analysis.
Turn the report into decisions
Every report should end with a short decision section. State what changed, why it likely changed, what evidence supports the explanation and what action will be tested next.
Examples include reallocating attention toward higher-value services, improving availability for qualified leads, auditing low-quality categories, tightening lead-status definitions or holding spend steady until follow-up gaps are resolved. The right action depends on the evidence; reporting should make that evidence visible.
Local Services Ads reporting becomes valuable when it connects platform activity to the economics and operations of the business. For a broader view of channel planning, measurement and optimization, visit the paid media resource hub. For the channel context and related strategy, explore the Local Services Ads guide.
Practical implementation checklist
- Define lead, qualified lead, booking, completed job and revenue.
- Choose one lead-level record as the source for outcome reporting.
- Reconcile platform totals with CRM, call and finance records.
- Track service, location, contact type and lead-quality reasons.
- Add response time and booking stages.
- Separate disputed contacts from broader quality analysis.
- Report cost per lead, qualified rate, booking rate and cost per booked job together.
- Use a documented attribution and date rule.
- Review weekly for operations and monthly for performance.
- End each report with evidence-based actions and owners.