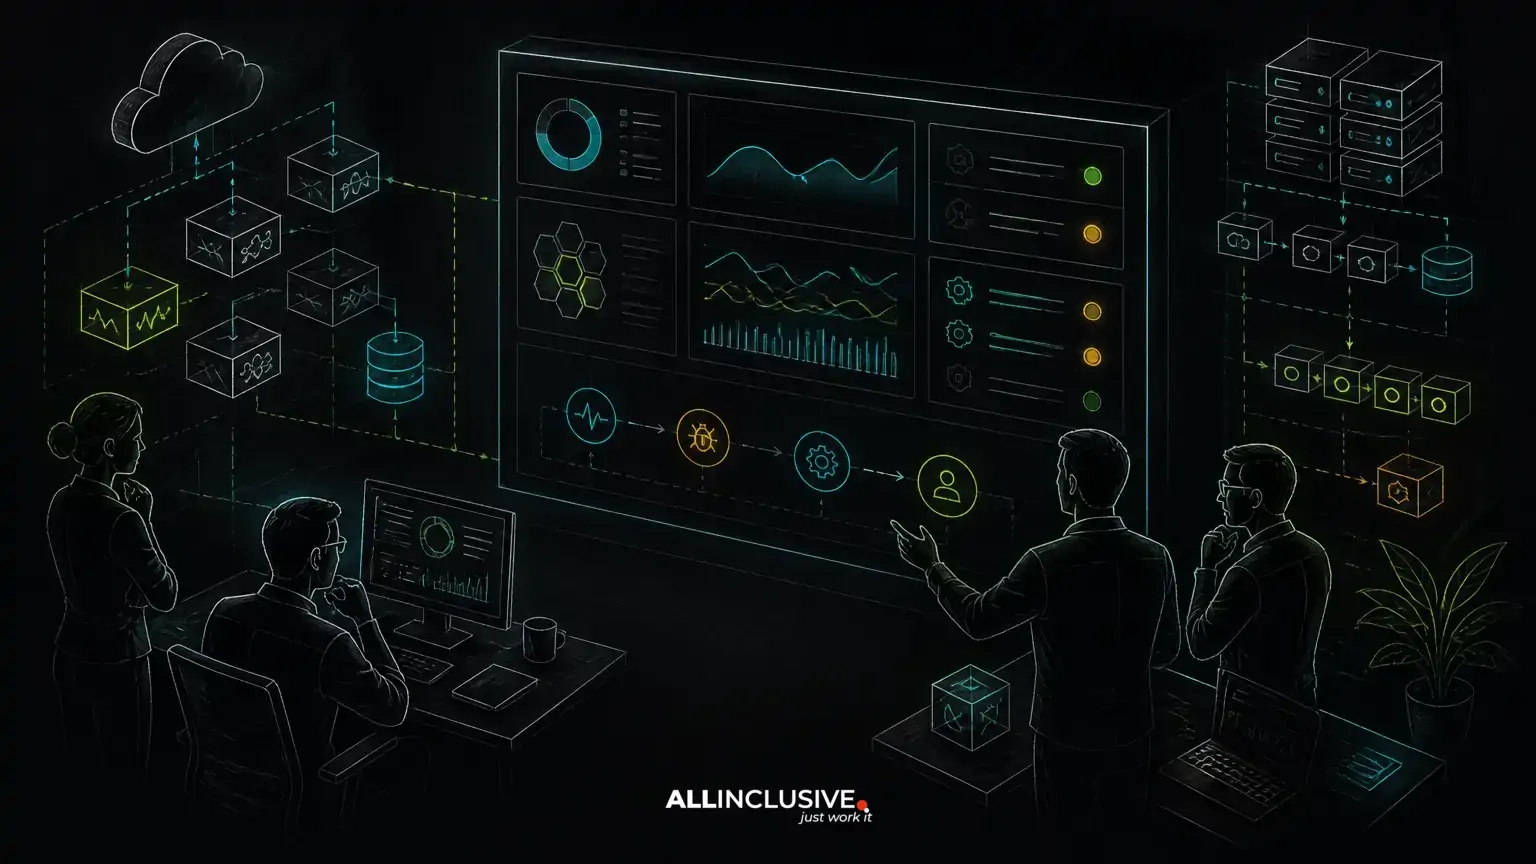
Monitoring is useful only when it helps a team detect a meaningful change, understand its likely cause and respond before the issue becomes a user complaint. A sound application monitoring checklist therefore covers more than uptime. It connects application behavior, infrastructure, dependencies, security events and business workflows to clear owners and response actions.
This matters especially when a team takes ongoing ownership of a custom Laravel, PHP or Python application. Mature systems often contain inherited code, scheduled jobs, third-party integrations and release processes that are not obvious from a dashboard. Monitoring should make those operational risks visible without creating a flood of alerts nobody can act on.
Start with the user journeys the application must protect
Before selecting metrics, identify the workflows whose failure would affect revenue, operations, compliance or customer trust. Examples might include signing in, submitting an order, processing a payment, uploading a document, receiving a notification or completing an internal approval.
For each journey, record:
- The entry point and services involved
- The expected success condition
- Important dependencies, such as a database, queue, payment provider or model API
- Acceptable response time and failure behavior
- The team responsible for investigation
- The fallback or manual process if the journey is unavailable
This approach prevents a common mistake: declaring an application healthy because its web server responds while a critical background process, integration or business transaction is failing.
Application monitoring checklist: the signals to cover
1. Availability and endpoint health
Basic availability checks should confirm more than that a domain returns an HTTP response. Monitor important routes and APIs with checks that reflect expected behavior, including authentication where appropriate and a safe read-only transaction when a deeper test is justified.
Track availability separately for critical user journeys and lower-priority features. A marketing page, administrative export and checkout endpoint should not necessarily have identical alert thresholds or escalation paths.
Also monitor:
- Unexpected redirects and authentication failures
- HTTP status-code changes, especially increases in server and gateway errors
- TLS certificate and domain configuration issues
- Health-check failures by region or deployment environment
2. Errors and exceptions
Centralized error tracking should capture exception type, route or job name, deployment version, environment and a correlation identifier. Group repeated events so one failing code path does not generate thousands of separate alerts.
Useful error monitoring distinguishes between:
- New errors introduced by a release
- Known errors whose frequency has materially changed
- Expected validation failures
- Dependency or network failures
- Unhandled exceptions that may expose a broader defect
Do not send sensitive request data, credentials or personal information into logs simply because it is convenient. Define redaction rules and review them as the application changes.
3. Latency and throughput
Average response time can hide the users experiencing the worst delay. Review latency distributions, such as percentile measurements, for critical endpoints and compare them across routes, releases and traffic patterns. The right threshold depends on the workflow and its expected behavior; it should not be copied blindly from another system.
Monitor throughput as well as latency. A sudden drop in requests, jobs, payments or messages may indicate a routing, authentication or queue problem even when individual requests remain fast. Conversely, an unexpected traffic increase can create resource pressure before the application produces visible errors.
4. Databases, queues and scheduled jobs
Many production incidents originate below the web request layer. Include database connection failures, slow queries, lock contention, connection-pool exhaustion, storage capacity and replication or backup signals where the architecture uses them.
For queues and workers, monitor queue depth, job age, retry counts, failed jobs and worker availability. A queue that is technically accepting messages may still be unhealthy if processing is falling behind. Scheduled tasks also need explicit monitoring: record whether each expected run occurred, how long it took and whether it completed successfully.
Laravel applications may rely on queues, scheduled commands and cache services; PHP applications may depend on web-server and runtime configuration; Python systems may use task workers, asynchronous services or separate data pipelines. The exact tooling can differ, but the operational question is the same: can the team tell whether work was accepted, processed and completed?
5. Infrastructure and resource saturation
Monitor the resources that can constrain application behavior: CPU, memory, disk space, network capacity, container or virtual-machine health and platform limits. Resource metrics are most useful when correlated with application symptoms and deployment events.
Set warning thresholds early enough to allow investigation, not merely to confirm an outage. At the same time, avoid treating every short-lived spike as an incident. Sustained saturation, repeated bursts, process restarts and exhausted limits are usually more actionable than isolated readings.
6. External dependencies and integrations
Payment providers, identity services, email delivery, file storage, analytics platforms and AI or data APIs can fail independently of your application. Track request volume, latency, error categories, timeouts, retry behavior and rate-limit responses for each important dependency.
Where possible, design integrations with bounded timeouts, safe retries and idempotency. Monitoring should reveal whether a dependency is failing, but the application should also fail in a controlled way. A timeout that blocks a request indefinitely is both a performance problem and an incident-amplification mechanism.
7. Security-relevant activity
Application monitoring does not replace dedicated security controls, but it should surface operational signals that may indicate abuse or compromise. Examples include repeated authentication failures, unusual privilege changes, unexpected administrative actions, suspicious request patterns, disabled audit logging and changes to critical configuration.
Security alerts require careful access control and retention decisions. Limit sensitive logs to authorized personnel, preserve enough context for investigation and establish who can approve containment actions such as disabling an account or rotating a credential.
8. Releases, configuration and change events
Every alert is easier to interpret when the team can see what changed. Record deployments, migrations, feature-flag changes, configuration updates, dependency updates and infrastructure changes alongside application telemetry.
For each release, compare error rates, latency, resource use and critical transaction success before and after deployment. A rollback plan should be documented, but rollback is not always safe when a database migration, queued job or external contract has changed. Release monitoring must account for those dependencies.
Turn metrics into alerts people can act on
A metric becomes an alert when it crosses a condition that requires a decision. For every alert, define:
- Condition: what changed and for how long?
- Impact: which users, workflows or data may be affected?
- Owner: who investigates first?
- Urgency: what response time is appropriate?
- First actions: which dashboard, runbook or recent change should be checked?
- Escalation: when does the issue move to another engineer, vendor or business owner?
Use separate notification paths for urgent incidents, warnings and information. An alert that pages someone overnight should represent a condition that warrants immediate attention. Lower-priority signals can create a ticket or appear in a review queue.
Review alert quality after incidents and near misses. Remove duplicate alerts, adjust thresholds that create noise and add coverage for failures discovered through user reports. Alert fatigue is not a minor inconvenience; it reduces the probability that the next important signal receives prompt attention.
Connect monitoring to incident response and service commitments
Monitoring has operational value only when it connects to a response model. Define severity levels based on user and business impact, not merely on the component that failed. A small error rate on an internal report may be less urgent than a smaller number of failures affecting account access or payment confirmation.
Document who may declare an incident, who communicates with stakeholders, how status updates are issued and when a post-incident review is required. If your support arrangement includes response targets, align alert routing and ownership with the agreed service levels. The related software maintenance SLA guide explains how response times and severity definitions should work together.
For a deeper operational sequence, see web application incident response, which covers the path from initial alert through investigation and root cause analysis.
Account for inherited code and technical debt
When a team inherits a custom application, monitoring often exposes gaps in documentation and ownership before it exposes code defects. Start by mapping production components, deployment paths, credentials, scheduled work, integrations and data stores. Confirm which environments are monitored and whether their signals are distinguishable.
Do not attempt to instrument every legacy module at once. Prioritize workflows with high business impact, unstable dependencies and limited recovery options. Add context around risky areas, then use incident evidence to guide broader observability and refactoring work.
Monitoring can also support a technical debt roadmap. Repeated timeouts, manual recovery steps, fragile deployments and unexplained background failures are evidence that a component may need stabilization, refactoring, migration or replacement. Monitoring does not decide which option is correct, but it provides operational evidence for that decision. The technical debt reduction roadmap offers a way to prioritize those findings without turning every defect into a rebuild.
Review the checklist before declaring coverage complete
Use this review with the people who operate and depend on the application:
- Are critical user journeys monitored end to end?
- Can the team distinguish application errors from dependency failures?
- Are latency, throughput, queue age and scheduled jobs covered?
- Are database, storage, memory and connection limits visible?
- Do logs include deployment version and correlation context?
- Are sensitive values redacted and access to telemetry controlled?
- Does each urgent alert have an owner, severity and first response action?
- Can the team identify recent releases and configuration changes?
- Is there a tested rollback, recovery or manual-workaround path?
- Are recurring incidents feeding maintenance and roadmap decisions?
Ongoing application ownership is broader than keeping a server online. It includes monitoring, security patches, dependency updates, upgrades, incident response, performance work and release continuity. Teams looking for support across those responsibilities can review software support and maintenance services or explore how custom software development capabilities can support an application beyond its initial launch. For organizations that need sustained product and engineering capacity, a dedicated product team can provide a consistent ownership model across maintenance and roadmap delivery.