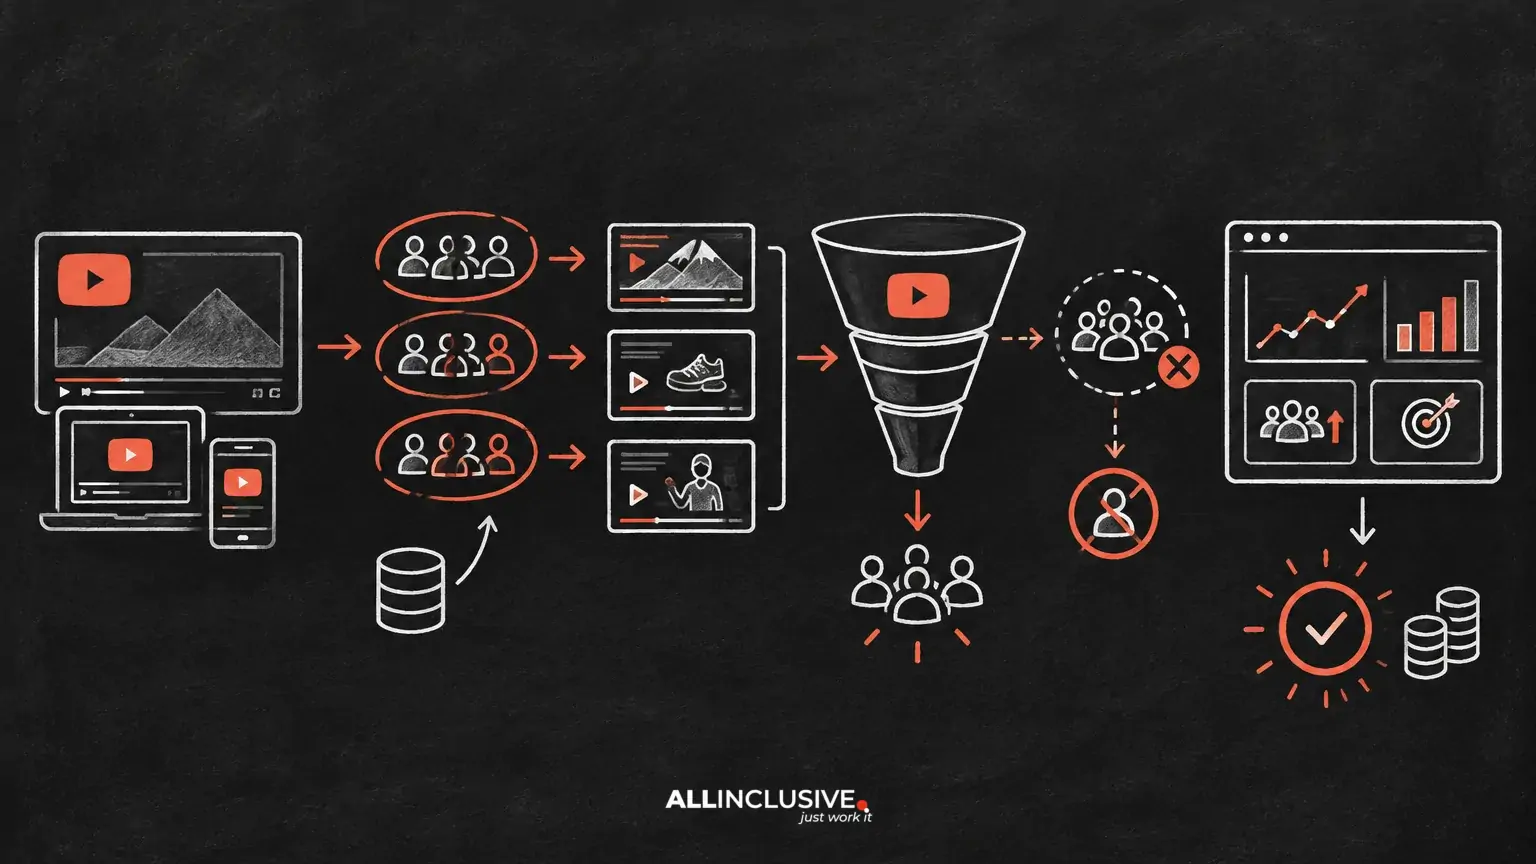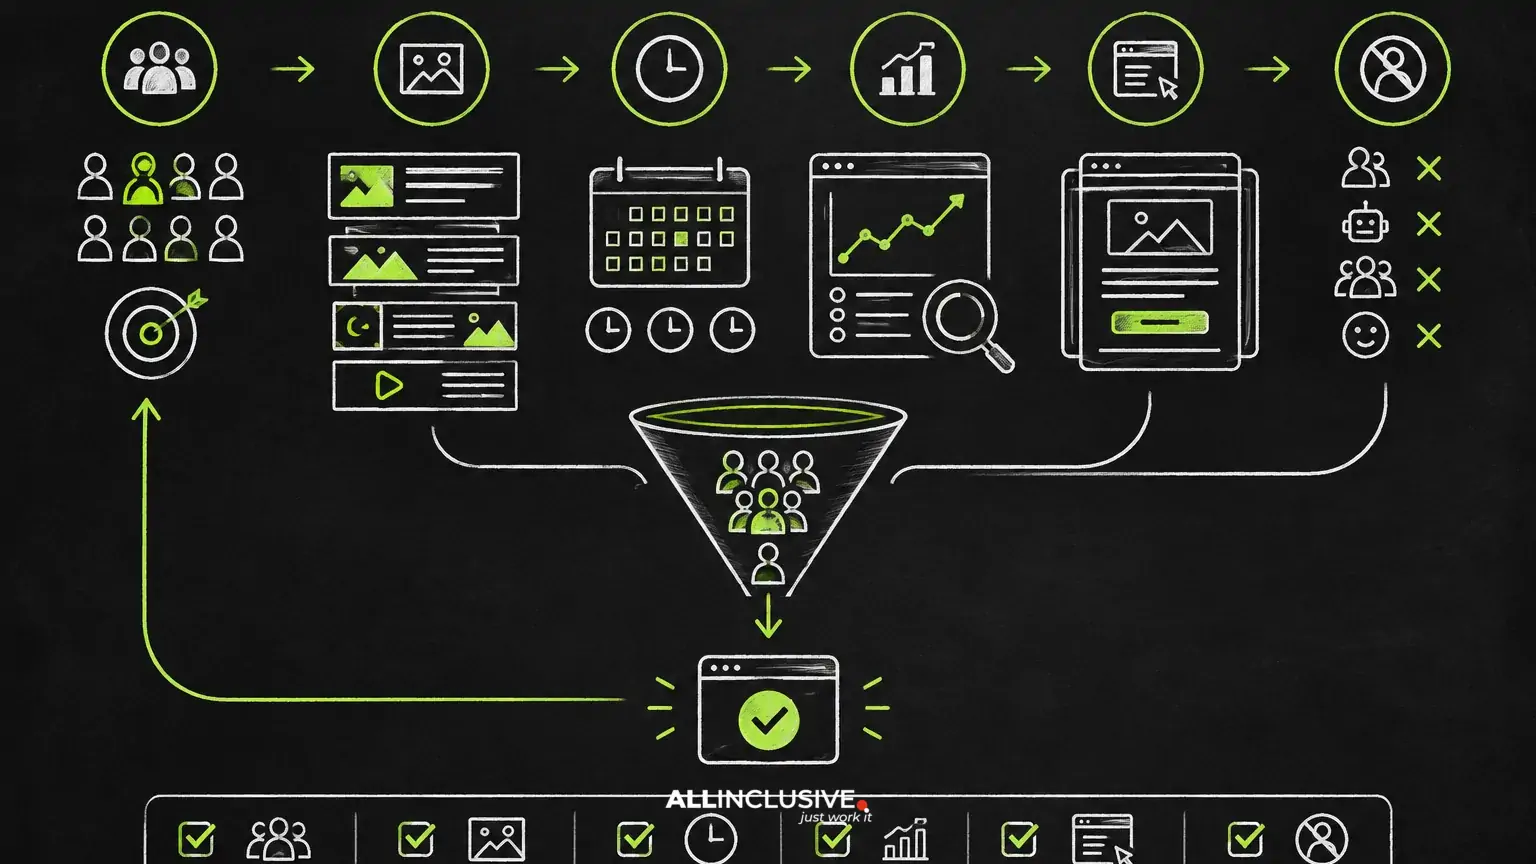
CTR and ROAS are useful signals, but they rarely explain whether a remarketing program is creating incremental business or simply capturing demand that would have converted anyway. The most useful remarketing KPIs connect audience behavior, conversion quality, cost efficiency, and incrementality.
A strong measurement framework therefore tracks the full path from audience eligibility to post-click action and, where possible, compares exposed audiences with an appropriate control group. The right KPI set depends on your objective: recovering abandoned carts, accelerating a B2B pipeline, reactivating customers, or improving repeat purchase rate.
Start with the business question
Before selecting metrics, define what the campaign is meant to change. A remarketing campaign can have several legitimate goals, including:
- Conversion recovery: encourage a qualified visitor to complete a purchase, form, booking, or application.
- Pipeline progression: move known prospects from research to a sales conversation, opportunity, or closed-won stage.
- Customer growth: drive repeat purchases, renewals, upgrades, or cross-sells.
- Efficient reach: maintain consideration among a high-value audience without excessive exposure.
Each goal calls for a different primary outcome. A cart-recovery campaign may prioritize incremental completed orders and contribution margin. A long B2B buying cycle may need qualified-account engagement, opportunity creation, and pipeline value instead of immediate revenue.
For broader planning context, see our remarketing strategy guide and the paid media hub.
The core remarketing KPI framework
1. Eligible audience size and reach
Measure how many users or accounts qualify for remarketing and how many are actually reached. These metrics establish whether delivery reflects the intended strategy.
- Eligible audience size: the population that meets your audience rules before delivery constraints and exclusions.
- Reach rate: the share of eligible users or accounts exposed during the selected period.
- Audience coverage: delivery by segment, such as product viewers, pricing-page visitors, leads, customers, or high-value accounts.
- Audience freshness: the age distribution of users entering and remaining in the audience.
A low reach rate may indicate limited scale, restrictive consent or matching conditions, insufficient traffic, or an overly narrow segment. A very high reach rate is not automatically positive; it may reflect broad targeting that weakens relevance.
2. Frequency and recency
Frequency shows how often people are exposed to ads, while recency measures the time since a user performed the qualifying action. Together, they help assess whether pressure is proportionate to intent.
Review frequency by audience age and segment rather than relying only on an account-level average. A 30-day audience can hide a heavy concentration of impressions in the first few days. For high-intent users, early frequency may be reasonable; for low-intent visitors, repeated exposure can create waste or fatigue.
Useful diagnostic questions include:
- Does conversion rate decline as exposure count rises?
- Are older audience members receiving a disproportionate share of spend?
- Does performance differ materially between recent and long-dated visitors?
- Are existing customers or converters still being served because exclusions are incomplete?
For a deeper approach to timing, review remarketing window strategy.
3. Engagement quality, not just CTR
CTR can indicate whether an ad earns attention, but it does not prove that the click is valuable. Pair it with post-click quality measures:
- Engaged-session rate: the share of clicks producing meaningful site or product engagement under your analytics definition.
- Landing-page interaction: completion of key actions such as viewing pricing, using a calculator, downloading a document, or starting checkout.
- Qualified visit rate: the proportion of visits meeting a pre-defined quality threshold.
- Return-to-conversion rate: the share of remarketing clicks that progress to the intended conversion.
A high CTR with weak downstream engagement can indicate curiosity, misleading creative, accidental clicks, poor landing-page alignment, or an audience that is not ready to act. A lower CTR with strong qualified engagement may be more valuable in a high-consideration purchase journey.
4. Conversion rate by audience and stage
Conversion rate should be segmented by the action that qualified someone for remarketing. Product viewers, cart abandoners, existing leads, and past customers should not be judged as one population.
Track both click-through conversion rate and, where appropriate, view-through conversions with caution. The key questions are whether the conversion is defined consistently, whether duplicate credit is controlled, and whether the action represents genuine business value.
For B2B programs, use a staged funnel such as:
- Remarketing click or engaged visit.
- Content, pricing, demo, or contact action.
- Marketing-qualified or sales-accepted lead.
- Opportunity creation.
- Closed-won revenue or retained account value.
This prevents the campaign from appearing successful because it generates inexpensive low-intent forms while failing to improve pipeline quality.
5. Cost efficiency and value
CPM, CPC, CPA, and ROAS are useful efficiency measures, but they answer different questions. Interpret them alongside margin, conversion quality, and the stage at which value is recognized.
- Cost per qualified visit: useful when the first conversion is too shallow to represent business value.
- Cost per qualified lead: more meaningful than cost per form completion when lead quality varies.
- Cost per opportunity: appropriate for many B2B programs with long sales cycles.
- Pipeline or revenue per dollar spent: useful when values are consistently defined and not based only on modeled assumptions.
- Contribution-margin ROAS: preferable to revenue ROAS when product margins vary materially.
Do not compare these metrics without aligning attribution windows, conversion definitions, currency, and value rules. A campaign with a lower CPA can still be less profitable if its conversions produce less qualified revenue.
6. Lead and customer quality
Quality metrics are often the most important remarketing KPIs for B2B advertisers. Review whether leads match the intended customer profile, engage with sales, progress through the pipeline, and produce revenue at an acceptable rate.
Potential measures include:
- Lead-to-opportunity rate.
- Opportunity-to-close rate.
- Average deal value by audience segment.
- Sales acceptance or rejection rate.
- Time from remarketing interaction to opportunity or purchase.
- Renewal, repeat-purchase, or expansion rate for customer audiences.
Use cohort reporting where the sales cycle is long. A recent campaign may look weak on closed-won revenue simply because its cohort has not had enough time to mature.
Incrementality: the KPI that challenges false efficiency
Remarketing often reaches people who already showed intent. As a result, attributed conversions can overstate the effect of advertising. Incrementality asks a different question: how many additional outcomes occurred because the campaign ran?
The strongest approach is a controlled test in which a comparable eligible group is withheld from advertising or exposed to a suitable control condition. Compare outcomes between groups while accounting for audience eligibility, timing, geography, device mix, and conversion lag.
Useful incremental measures include:
- Incremental conversion rate.
- Incremental conversions per thousand eligible users.
- Incremental cost per conversion.
- Incremental revenue or contribution margin.
- Incremental pipeline created or influenced under a clearly defined test design.
When a randomized test is not feasible, use caution with observational comparisons. Differences between exposed and unexposed users may reflect pre-existing intent rather than advertising impact. Do not present attributed ROAS as incremental ROAS without a defensible methodology.
For related measurement risks, read remarketing attribution: avoiding false ROAS and double counting.
How to build a practical KPI hierarchy
Keep reporting focused by assigning metrics to three levels:
Primary KPI
Select one outcome that best represents the campaign objective. Examples include incremental purchases, qualified opportunities, contribution margin, or repeat revenue.
Diagnostic KPIs
Use these to explain performance: reach, frequency, audience recency, CTR, qualified visit rate, conversion rate, CPA, and funnel progression.
Guardrail KPIs
Guardrails identify harmful or misleading outcomes. Examples include exclusion compliance, invalid or duplicate conversions, lead rejection rate, frequency concentration, unsubscribes, customer complaints, and spend outside the intended audience.
This hierarchy prevents teams from optimizing toward every available metric at once. It also makes it clearer when a campaign should be scaled, revised, limited, or stopped.
Example: evaluating a B2B remarketing campaign
Suppose a software company targets visitors who viewed a solution page but did not request a demo. CTR rises after a creative change, yet demo completions remain flat. A shallow report might call the change successful. A stronger review would examine:
- Whether clicks produced meaningful solution-page or pricing-page engagement.
- Demo completion rate by audience recency.
- Cost per sales-accepted lead rather than cost per form.
- Lead-to-opportunity rate by creative and audience segment.
- Frequency among users exposed to the new message.
- Whether a control group showed a similar increase in demos.
If CTR increased but qualified visits and opportunity creation did not, the creative may be attracting attention without improving business outcomes. If both exposed and control groups improved, the change may coincide with broader demand rather than cause the improvement.
Measurement implementation checklist
- Document the objective: state the audience, desired action, value event, and acceptable cost.
- Define conversion stages: distinguish micro-conversions from qualified business outcomes.
- Standardize values: document revenue, margin, pipeline, or modeled values and who owns them.
- Apply exclusions: remove converters, current customers, employees, duplicate records, and other ineligible groups where appropriate.
- Segment reporting: break out audience type, recency, creative, device, geography, and funnel stage when sample size permits.
- Set a conversion window: use a consistent window that reflects the buying cycle and avoid changing it without documenting the effect.
- Audit attribution: check duplicate events, cross-channel overlap, view-through credit, and offline conversion imports.
- Plan testing: reserve a methodology for holdouts or other incrementality analysis before scaling spend.
Audience rules and exclusions directly affect KPI interpretation. A campaign that continues targeting people after purchase can inflate attributed conversions while wasting spend; review remarketing exclusions for practical safeguards.
What not to do
- Do not optimize every audience to the same KPI.
- Do not treat CTR as proof of intent or ROAS as proof of incrementality.
- Do not compare campaigns with different attribution windows or value definitions.
- Do not judge a long-cycle B2B campaign before its cohorts have matured.
- Do not combine prospecting, customer retention, and cart recovery in one undifferentiated report.
- Do not ignore the opportunity cost of serving ads to users who would have converted without them.
Remarketing KPIs: What to Prioritize
The best remarketing KPI framework is not a longer dashboard. It is a clear chain from audience eligibility to meaningful business value. Use reach, recency, frequency, engagement, conversion quality, cost, pipeline or revenue, and incrementality together. CTR and ROAS can remain useful diagnostics, but they should not be the final judgment on whether remarketing is working.