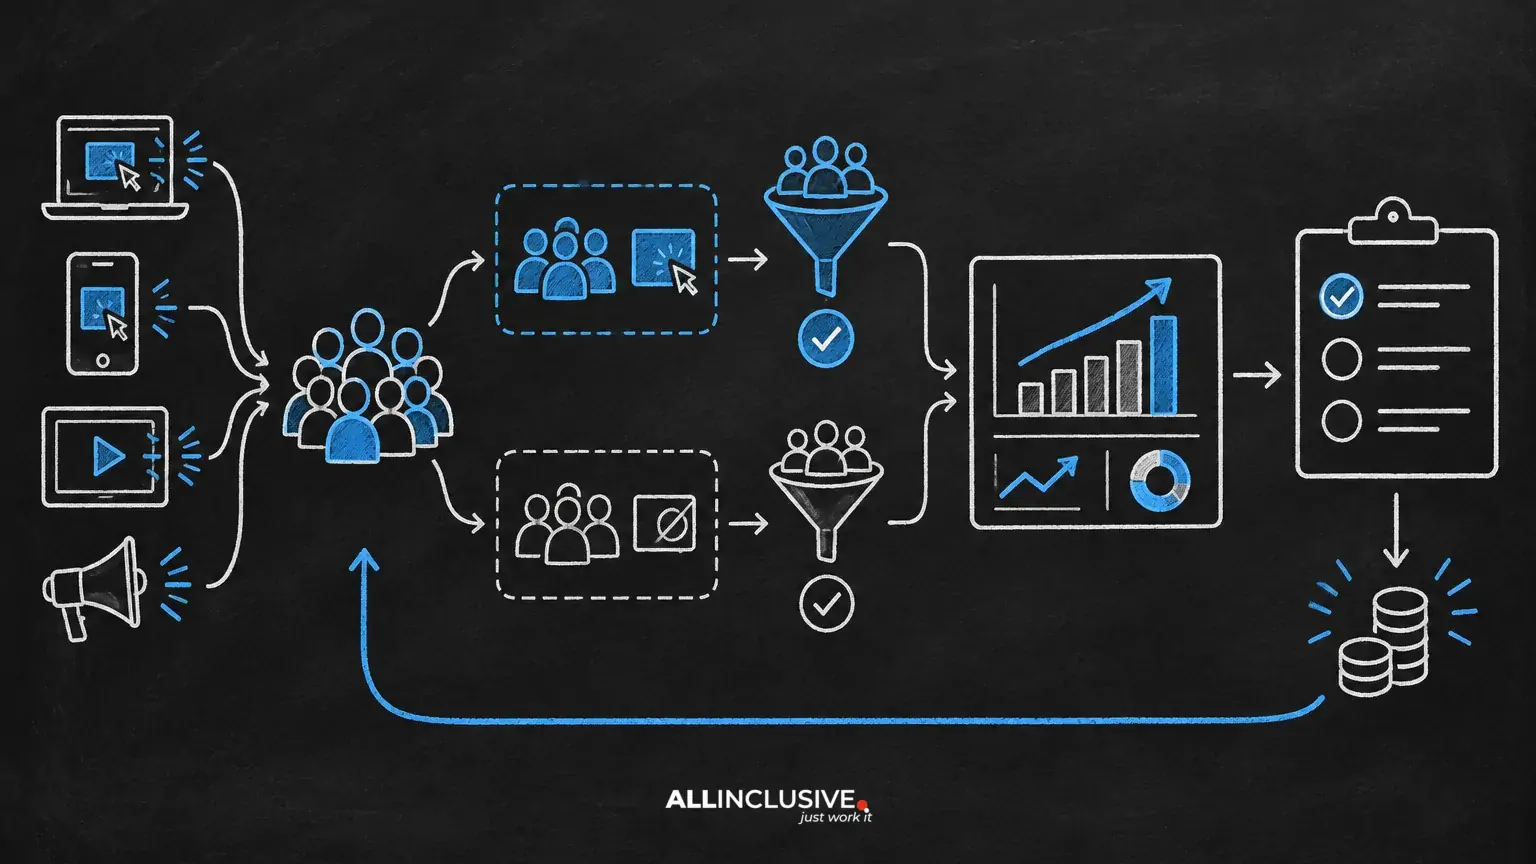
Paid media ROAS is often treated as a simple equation: revenue divided by advertising spend. The arithmetic is easy. The interpretation is not.
Platform-reported ROAS can help marketers monitor campaigns, compare creative or identify changes in efficiency. But it usually reflects only the conversions and revenue the platform can observe and assign to its ads. It may not account fully for contribution margin, repeat purchases, lead quality, cancellations, cross-channel influence, organic demand or the conversions that would have happened without advertising.
A stronger measurement approach treats platform ROAS as one signal—not the final business verdict. The goal is to connect media spend to economically meaningful, incremental outcomes.
What paid media ROAS actually measures
The basic formula is:
ROAS = attributed revenue ÷ advertising spend
For example, if a campaign reports $50,000 in attributed revenue from $10,000 in spend, its reported ROAS is 5.0, or 500%.
That result is only meaningful when the numerator and denominator are defined consistently. Important questions include:
- Is revenue measured before or after discounts, refunds, cancellations and taxes?
- Does the revenue represent completed purchases or estimated value from leads?
- Which attribution window and model assign credit to the campaign?
- Are conversions deduplicated across ad platforms and analytics systems?
- Does the reported revenue include new and returning customers?
- Are media costs inclusive of all relevant placements, fees and currencies?
Two channels can each report a ROAS of 4.0 while producing very different business outcomes if one drives high-margin new customers and the other captures existing demand or generates low-quality orders.
Why platform ROAS is not the whole story
Attributed revenue is not necessarily incremental revenue
Most advertising measurement systems assign credit according to observed interactions. That credit does not prove the ad caused the purchase.
A customer may have already intended to buy, searched for the brand, visited through another channel or returned directly after seeing an ad. The platform may still receive conversion credit. This is especially important for branded search, retargeting and campaigns aimed at audiences already familiar with the company.
Incrementality asks a different question: what additional outcome occurred because advertising was present? Answering it usually requires testing, such as a geographic experiment, audience holdout or another carefully designed comparison. For a deeper framework, see incrementality testing for paid media.
Revenue does not equal profit
ROAS uses revenue, but media decisions should usually be governed by profit or contribution economics. Product margin, fulfillment, payment processing, returns, discounts and customer support can materially change the value of a sale.
A campaign with a lower ROAS may be more attractive if it sells products with stronger margins. Conversely, a high-revenue campaign can destroy value if the underlying contribution margin is thin.
A contribution-based alternative is:
Contribution ROAS = contribution profit attributable to media ÷ advertising spend
The exact cost structure depends on the business. The important principle is to define the economic numerator before setting efficiency targets.
Lead-generation ROAS often depends on modeled value
For businesses that sell through a sales team, the initial conversion may be a form submission, booked meeting or phone call rather than a transaction. A platform can report leads quickly, but lead count alone says little about pipeline quality or revenue realization.
A more useful measurement chain connects media to downstream stages:
- Ad interaction or landing-page visit
- Qualified lead
- Sales-accepted opportunity
- Won opportunity
- Collected revenue or contribution profit
Estimated revenue can be useful for optimization, but it should be clearly labeled as modeled or predicted value. Actual closed-won data should be used for validation wherever possible. Offline conversion tracking explains how downstream events can be connected back to paid media systems.
Customer quality and payback may be hidden
A first-order ROAS view can undervalue campaigns that acquire customers likely to purchase again. It can also overvalue campaigns that produce one-time buyers with high service costs or weak retention.
Depending on the business model, useful companion measures may include:
- New-customer acquisition cost
- First-order contribution margin
- Repeat purchase rate
- Customer payback period
- Customer lifetime value, with assumptions stated clearly
- Retention or churn by acquisition source
Lifetime value should not be used as an excuse to ignore near-term cash flow. A sound framework separates observed results from forecasts and sets acceptable payback limits.
A practical ROAS framework
1. Define the decision before choosing the metric
Measurement should support a decision. Are you deciding whether to increase spend, shift budget between campaigns, acquire new customers, protect margin or generate qualified pipeline?
Each decision may require a different primary metric. A direct-to-consumer business might prioritize contribution profit and payback. A B2B organization may prioritize qualified pipeline, expected gross profit or closed-won revenue. A brand campaign may need reach, demand indicators and incremental lift rather than immediate ROAS alone.
2. Establish a measurement hierarchy
Use a hierarchy that moves from immediate reporting to business validation:
- Delivery: spend, impressions, clicks and reach.
- Response: visits, engagement, leads, purchases and conversion rate.
- Attributed value: platform revenue, analytics revenue, pipeline or modeled value.
- Economic value: contribution profit, qualified pipeline, collected revenue or customer value.
- Incremental value: outcomes caused by advertising relative to a credible counterfactual.
The lower levels are not replacements for the higher ones. Delivery and response metrics help diagnose performance; economic and incremental metrics help govern investment.
3. Reconcile the data before optimizing
Large differences between platforms, analytics tools and finance records are common. They can result from different conversion definitions, time zones, attribution windows, refund timing, consent status, deduplication rules or reporting delays.
Create a reconciliation table with a fixed reporting period and document:
- Spend source and inclusion rules
- Conversion event definitions
- Revenue recognition timing
- Attribution model and lookback window
- Currency and timezone treatment
- Refund, cancellation and duplicate handling
- Whether figures are observed, estimated or imported
Do not force systems to match by changing numbers without understanding the cause. A consistent, transparent difference is more useful than artificial agreement.
4. Segment the result
Blended ROAS can conceal important variation. Segment by dimensions that change the economics or decision:
- New versus returning customers
- Product, service line or margin band
- Market, region or language
- Campaign objective and audience type
- Creative concept and landing page
- Lead source, qualification stage or sales segment
Use enough volume and time to avoid reacting to random variation. Small segments can be useful diagnostically while remaining unsuitable for aggressive budget decisions.
ROAS, ROI and related measures
ROAS and ROI are not interchangeable.
- ROAS compares attributed revenue with advertising spend.
- ROI compares return with investment, usually after defining costs and profit more broadly.
- MER, or marketing efficiency ratio, typically compares total revenue with total marketing spend and is less dependent on channel-level attribution.
- Customer acquisition cost measures spend per acquired customer, but not necessarily customer profitability.
- Cost per qualified opportunity focuses on sales quality rather than lead volume.
None is universally superior. The right measure depends on the business model, available data and decision being made. The mistake is using a channel-attributed revenue ratio as if it were a complete profitability or causality measure.
How to set a useful ROAS target
Start with economics rather than copying a competitor’s benchmark. A simplified break-even ROAS can be expressed as:
Break-even ROAS = 1 ÷ contribution margin rate
If the contribution margin rate is 40%, the simplified break-even ROAS is 2.5 before considering other constraints or customer value. This is an illustrative calculation, not a universal target. The margin definition must be agreed with finance, and the calculation should reflect the business’s treatment of variable costs.
Then adjust the target for strategic context:
- New-customer acquisition may tolerate a different payback period than retention.
- Inventory constraints can make a lower-volume, higher-margin approach preferable.
- Growth investment may justify a measured short-term loss if the assumptions are explicit and monitored.
- Brand and demand-generation activity may not produce reliable direct-response ROAS in the same period.
Paid Media ROAS: Implementation Checklist
- Write a one-sentence definition of ROAS for the organization.
- Specify whether revenue is gross, net, collected or modeled.
- Document attribution windows, models and conversion events.
- Separate new-customer, returning-customer and lead-stage reporting.
- Import qualified or closed outcomes where the sales cycle requires it.
- Build contribution-margin and payback views alongside platform ROAS.
- Use tests or other causal methods to assess incrementality for major budget decisions.
- Set review periods that reflect conversion delay and sales-cycle length.
- Annotate tracking changes, promotions, pricing changes and operational disruptions.
- Give each metric a clear owner and decision rule.
Paid Media ROAS: Mistakes to Watch For
- Optimizing to the easiest event: High-volume microconversions can improve reported efficiency without improving business outcomes.
- Comparing incompatible ROAS values: Different platforms may use different revenue, attribution and conversion definitions.
- Ignoring demand capture: Retargeting and branded activity may harvest existing intent rather than create equivalent incremental demand.
- Using lifetime value without validation: Forecasts should be compared with observed retention and payback.
- Changing targets after the fact: Define the measurement basis before reviewing performance.
- Treating attribution as causality: Reported credit is evidence of an interaction, not automatic proof of advertising impact.
Build a measurement system, not a dashboard number
Paid media ROAS remains useful when its definition is stable and its limitations are visible. It can help teams monitor delivery, diagnose changes and make tactical decisions. It becomes dangerous when it is treated as a universal measure of profit or incremental growth.
The strongest operating model combines platform reporting with reconciled analytics, finance-aligned economics, downstream conversion data and periodic incrementality testing. For broader measurement context, explore Allinclusive’s paid media resources and the guide to paid media attribution.
The practical question is not simply, “What ROAS did the platform report?” It is, “What value did advertising create, how confidently can we measure it, and what decision should that evidence support?”