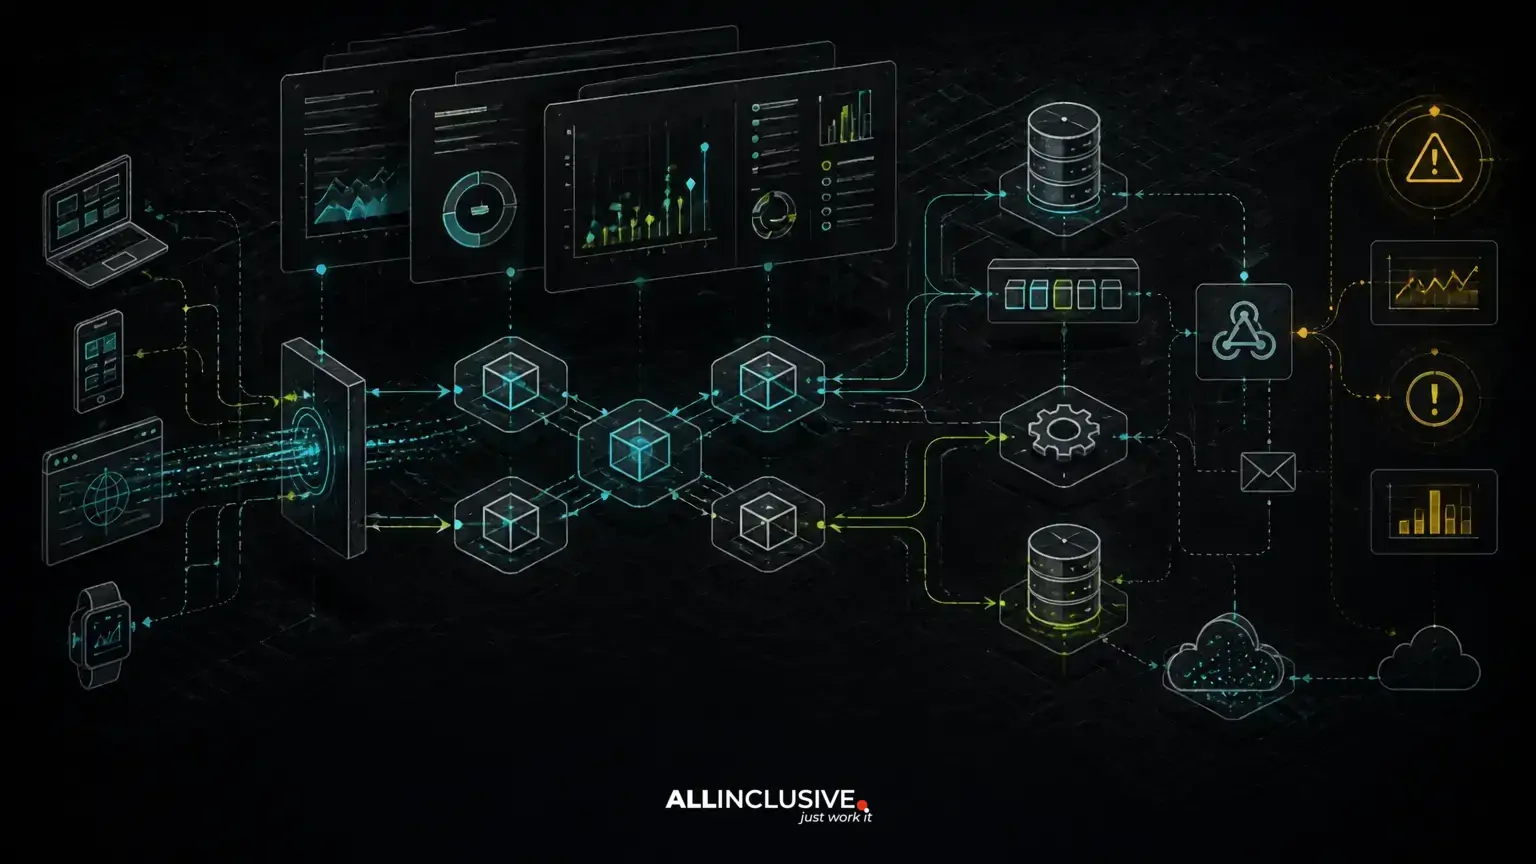
API uptime answers only one question: did the endpoint respond? It does not tell you whether responses were slow, incomplete, unauthorized, duplicated, stale or unusable by the consuming application. Effective api monitoring observability combines technical signals with integration context so teams can detect failures, explain their causes and understand their business impact. The api monitoring observability workflow also connects to the guidance in custom software development.
For a custom application, that means monitoring more than HTTP status codes. Teams should measure request performance, dependency behavior, validation failures, authentication events, queue and webhook processing, retry activity, reconciliation gaps and changes in API contracts. The goal is not to collect every possible metric. It is to create enough evidence to answer three operational questions quickly:
- What is failing?
- Which users, workflows or integrations are affected?
- What action will prevent recurrence or reduce impact?
This approach is part of broader API development, not an afterthought added after deployment. Monitoring requirements influence endpoint design, correlation identifiers, error handling, logging and the boundaries between synchronous and asynchronous work.
Why uptime monitoring misses integration failures
A basic health check may receive a successful response while the actual customer workflow is broken. An API can return HTTP 200 after accepting a request that later fails in a queue. A third-party dependency can respond successfully with incomplete data. A webhook can be delivered but rejected during signature verification. A payment or order request can be retried and create a duplicate side effect if idempotency is not enforced.
These failures are especially difficult because they often occur between systems. The originating API may be healthy while a downstream service is timing out, a worker is backlogged or a reconciliation process is missing records. Monitoring must therefore cover the full transaction path rather than a single URL.
The core API signals to measure
Request rate and traffic shape
Track request volume by endpoint, consumer, authentication context and response class where practical. Average traffic can look normal while a sudden burst, uneven tenant usage or a new client integration creates capacity pressure. Measuring traffic shape helps distinguish an application defect from an expected product event or abusive usage pattern.
For public or partner-facing APIs, rate-limit events deserve their own visibility. A rising count of rejected requests may indicate a misconfigured client, an overly restrictive policy or an attempted overload. Rate limiting should protect capacity without hiding legitimate workflow problems; the related design trade-offs are covered in API rate limiting.
Latency distributions, not just averages
Average latency can conceal a poor experience for a smaller but important group of requests. Measure latency by endpoint, operation type, consumer and dependency where possible. Percentiles such as p95 or p99 can reveal long-tail behavior, but the useful choice depends on traffic volume and the operational decision the metric supports.
Separate time spent in application code from time spent waiting on databases, external APIs, queues or network calls. A slow endpoint may need query optimization, a timeout policy, dependency isolation or a change from synchronous processing to an asynchronous workflow. Without those dimensions, a latency alert tells the team that a problem exists but not where to investigate.
Error rates by class and cause
Group errors into meaningful categories rather than treating every non-success response alike. Useful categories include:
- Client validation errors caused by malformed or incomplete input.
- Authentication and authorization failures.
- Rate-limit responses.
- Application and database failures.
- Dependency timeouts or upstream errors.
- Serialization, contract and schema mismatches.
- Asynchronous processing failures discovered after the initial response.
Track both the proportion and absolute count of errors. A low error percentage may still represent serious impact on a high-volume operation, while a high percentage on a rarely used administrative endpoint may need different prioritization. Stable error codes and structured error responses make these measurements more actionable for both operators and API consumers.
Monitor the API contract as well as the endpoint
Many integration incidents are contract failures, not infrastructure failures. A producer may remove a field, change a data type, alter an enum value or make a previously optional property mandatory. The endpoint remains reachable, but consumers can no longer process the response correctly.
Contract monitoring can include schema validation, compatibility checks in delivery pipelines and detection of unexpected request or response fields. For important integrations, record which contract version each consumer uses and monitor adoption before removing older behavior. A clear API versioning strategy reduces the risk of silent breakage and gives teams a controlled migration path.
Validation metrics are also useful product signals. A sudden increase in rejected fields may indicate a client defect, unclear documentation, a changed business rule or a user-interface workflow that is producing invalid data. Do not automatically classify all 4xx responses as harmless client noise.
Make authentication and authorization events observable
Authentication monitoring should show more than a count of failed logins. Measure token or credential failures, expired credentials, rejected scopes, unusual client activity and permission-denied responses by integration or service identity. These events may indicate a deployment configuration problem, a permissions change or an attempted misuse of the API.
Logs should support investigation without exposing access tokens, secrets or unnecessary personal data. Record the identity or client reference needed for diagnosis, but apply appropriate redaction, retention and access controls. For OAuth-based integrations, visibility into grant failures, scope mismatches and refresh behavior can prevent an outage that otherwise appears to be a generic authorization error. The design implications are discussed in OAuth 2.0 for API integrations.
Trace retries, idempotency and duplicate side effects
Retries are useful when failures are temporary, but they can amplify load or repeat an operation that was not safe to repeat. Monitoring should connect the original request with its retry attempts and show whether the operation was eventually successful, permanently failed or abandoned.
For operations that create orders, payments, records or other side effects, measure idempotency-key usage, duplicate suppression and conflicts caused by reused keys. A successful response after a retry does not prove that the workflow is correct if two downstream systems received the operation. Teams should be able to distinguish:
- An initial request that completed normally.
- A retry that safely returned the original result.
- A retry rejected because the request parameters differed.
- A request that may have reached a dependency before timing out.
This is why idempotency belongs in both API design and observability. The implementation patterns and failure cases are covered in API idempotency.
Observe webhooks, queues and asynchronous workflows
An API response often represents acceptance, not completion. If work is handed to a queue or sent through a webhook, monitoring must follow the event beyond the initial request.
For queues, measure depth, age of the oldest message, processing duration, throughput, retry counts and dead-letter volume. A queue can be available while its backlog grows beyond an acceptable business window. Alerting on age is often more meaningful than alerting only on message count because it reflects how long work has been waiting.
For webhooks, track delivery attempts, response codes, timeout duration, signature-validation failures, retry schedules and eventual delivery state. Record an event identifier so the sender and receiver can discuss the same event. Consumers should process events idempotently because delivery may be repeated, delayed or received out of order.
Where data moves between systems, reconciliation is essential. Compare expected and received records, identify gaps and expose records that remain pending beyond a defined time limit. Reconciliation catches failures that request-level monitoring cannot see, such as a dropped event or a downstream process that acknowledged data but did not persist it.
Use distributed tracing to connect one workflow
Logs, metrics and traces answer different questions. Metrics show that behavior changed. Logs provide detailed event context. Traces show how one request or business operation moved through services, databases, queues and external dependencies.
Propagate a correlation or trace identifier across synchronous calls and asynchronous boundaries where the architecture permits. Include operation name, endpoint, consumer, outcome and dependency timing in trace attributes, while avoiding sensitive payloads. A useful trace should help an engineer move from a customer-visible failure to the responsible service or dependency without manually searching unrelated log streams.
For asynchronous systems, preserve the relationship between the originating request, queued job, webhook event and reconciliation record. This creates an operational view of the workflow rather than a collection of disconnected technical events.
Design alerts around action and business impact
An alert should identify a condition that requires investigation or intervention. Alerting on every error produces fatigue; alerting only on total downtime misses partial failures. Good alert conditions are tied to a defined service objective, workflow deadline or operational risk.
Examples include:
- A critical endpoint's tail latency exceeds the acceptable workflow window.
- A dependency timeout rate rises while fallback behavior is being used.
- Queue age exceeds the period in which an order or notification remains useful.
- Webhook deliveries repeatedly fail for one partner.
- Contract validation rejects a new response shape after deployment.
- Reconciliation finds records that have not reached the system of record.
- Authentication failures increase for a specific integration after a credential change.
Each alert should have an owner, severity, runbook or investigation path and a way to suppress duplicate notifications during a known incident. Business-critical operations may warrant separate alerts from low-risk administrative traffic.
Choose an implementation approach in Laravel or Python
Laravel and Python can both support observable API integrations. The right choice depends on existing ownership, workload characteristics, team skills and operational boundaries rather than a universal framework preference.
In a Laravel application, middleware can establish request context, capture route and response metadata and apply consistent authentication or correlation behavior. Queued jobs and scheduled reconciliation tasks should expose their own states and failure records rather than relying only on the originating HTTP request. Domain-level events can connect order, payment or synchronization outcomes to technical telemetry.
In Python, the framework and deployment model influence how request middleware, workers, asynchronous tasks and dependency clients are instrumented. A service may need explicit context propagation across async boundaries and a consistent approach to timeouts, retries and structured exceptions. Python is often a good fit when integration services, data processing or asynchronous workloads are separated into focused components, but that separation also increases the need for trace continuity.
In either stack, establish common conventions for correlation identifiers, error codes, structured logs, metric names, timeout settings and sensitive-data handling. Consistency across services is usually more valuable than framework-specific instrumentation features.
A production checklist for API monitoring and observability
- Define the critical business workflows that cross API boundaries.
- Measure request rate, latency distributions and errors by endpoint and consumer.
- Separate client, authentication, application and dependency failures.
- Track validation and schema changes before they become consumer outages.
- Propagate correlation or trace identifiers across services and asynchronous work.
- Monitor retries, idempotency outcomes, queue age and dead-letter records.
- Measure webhook delivery, signature failures and eventual processing state.
- Reconcile important records across systems instead of relying only on transport success.
- Redact secrets and unnecessary personal data from logs and traces.
- Give each alert an owner, severity and documented response path.
API monitoring is the measurement layer; observability is the ability to explain what those measurements mean in a real workflow. When contracts, retries, authentication, queues and reconciliation are designed with operational evidence in mind, teams can reduce time spent guessing and make safer changes to custom software. Ongoing review and incident-driven refinement are part of responsible support and maintenance, especially as integrations and consumers change.