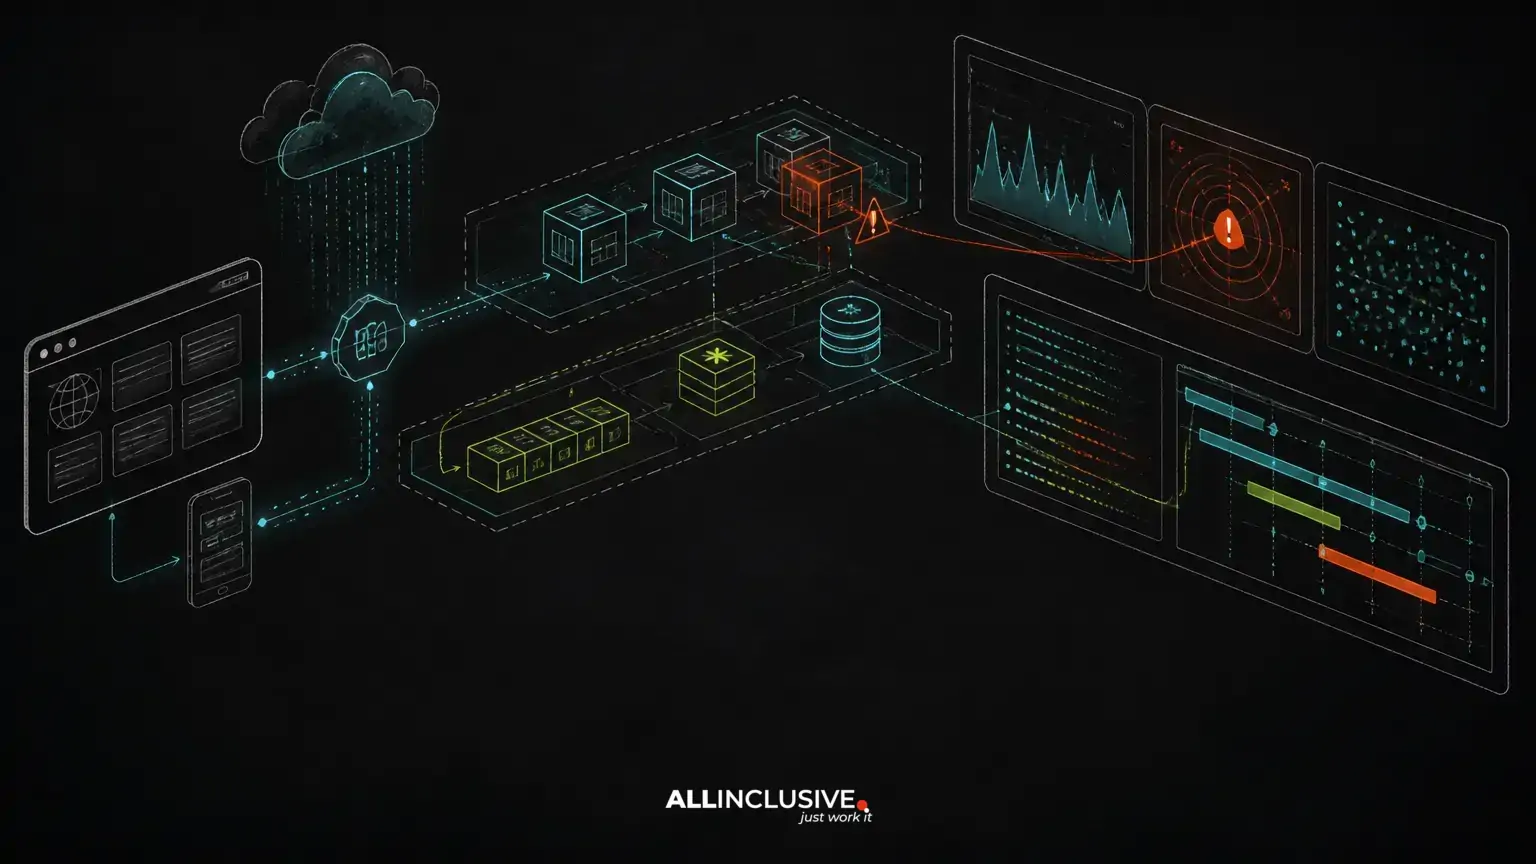
Web application observability is the practice of collecting and connecting the signals that explain what an application is doing: logs describe events, metrics show behavior over time, and traces follow individual requests across application components. During an incident, these signals help a team move from “something is slow” to a more precise understanding of what failed, who is affected and which action is safest.
For a custom web application, observability should be designed around real user workflows and operational dependencies—not added as a dashboard exercise after deployment. A useful implementation covers the web tier, databases, Redis, queues, scheduled jobs, containers, cloud infrastructure and deployment process. It also defines ownership, retention, alert thresholds and recovery procedures.
This article explains how to build that foundation without assuming that every application needs microservices or a large monitoring platform.
What logs, metrics and traces each reveal
The three primary observability signals answer different questions. Treating them as interchangeable creates blind spots during incidents.
Logs explain events and decisions
Logs record discrete events such as authentication failures, payment-provider responses, queue exceptions, cache misses or deployment changes. Structured logs are more useful than long text messages because fields can be filtered and correlated consistently.
A production request log might include a request ID, route name, HTTP status, duration, authenticated account identifier where appropriate, deployment version and a redacted error category. It should not include passwords, access tokens, payment data or unnecessary personal information.
Application logs should distinguish expected business events from failures. A rejected form submission, a failed database connection and an unhandled exception should not appear as indistinguishable messages. Consistent severity levels also make alerting and triage more reliable.
Metrics reveal trends and saturation
Metrics aggregate behavior into time-series measurements. Useful examples include request rate, error rate, latency percentiles, active workers, queue depth, database connection usage, cache hit behavior, container restarts and disk capacity.
Metrics are usually the fastest way to detect that an incident is occurring. They can show whether a problem affects all traffic or one route, whether latency is rising gradually or suddenly, and whether a queue is draining or accumulating work.
Metric labels require care. Labels such as route, status class and service role are generally useful. Unbounded values such as user IDs, order IDs or arbitrary URLs can create excessive time-series cardinality and unnecessary cost.
Traces connect a request to its dependencies
Distributed tracing follows a request through operations such as web handling, database queries, Redis calls, outbound APIs and asynchronous work. A trace can reveal that a slow page is not caused by application code itself but by a database query, an exhausted connection pool or a downstream service.
Tracing is valuable even in a modular monolith. A single deployable application can still contain multiple important boundaries: HTTP middleware, domain services, database access, cache operations and queue publication. Trace context can also help connect the request that created a job with the later worker activity, provided the correlation design is explicit.
Start with user workflows and failure domains
Observability becomes actionable when it maps to business-critical workflows. Begin by listing operations such as sign-in, checkout, file processing, report generation, administration and customer notifications. For each workflow, identify its synchronous and asynchronous steps, dependencies, expected completion behavior and acceptable failure response.
This exercise exposes the failure domains that generic infrastructure dashboards often miss. A server may be healthy while a queue is backed up, a payment callback is failing, or a particular database query is timing out. Conversely, a container restart may be noisy but harmless if the service recovers without user impact.
For each workflow, define:
- Availability signal: Can users initiate and complete the operation?
- Latency signal: How long do important steps take?
- Correctness signal: Are records, notifications or external side effects completed as intended?
- Dependency signal: Are databases, Redis, queues and external services responding?
- Recovery action: Who investigates, what can be rolled back, and what can be safely retried?
Instrument the web request path first
The initial observability layer should make ordinary HTTP requests diagnosable. Capture request duration, response status, route or controller name, request ID, deployment version and relevant tenant or account context in a privacy-conscious form.
Prefer stable route names over raw paths. A metric grouped by /users/{id} remains useful; one grouped by thousands of individual IDs can become difficult to query and expensive to retain. Record slow-request details separately when deeper information is needed, rather than logging every request at maximum verbosity.
Errors should preserve enough context to reproduce the failure: exception type, operation, dependency involved and correlation identifier. Avoid exposing stack traces or internal implementation details to users, but retain protected diagnostic information for authorized operators.
Cover databases, Redis and queues as first-class dependencies
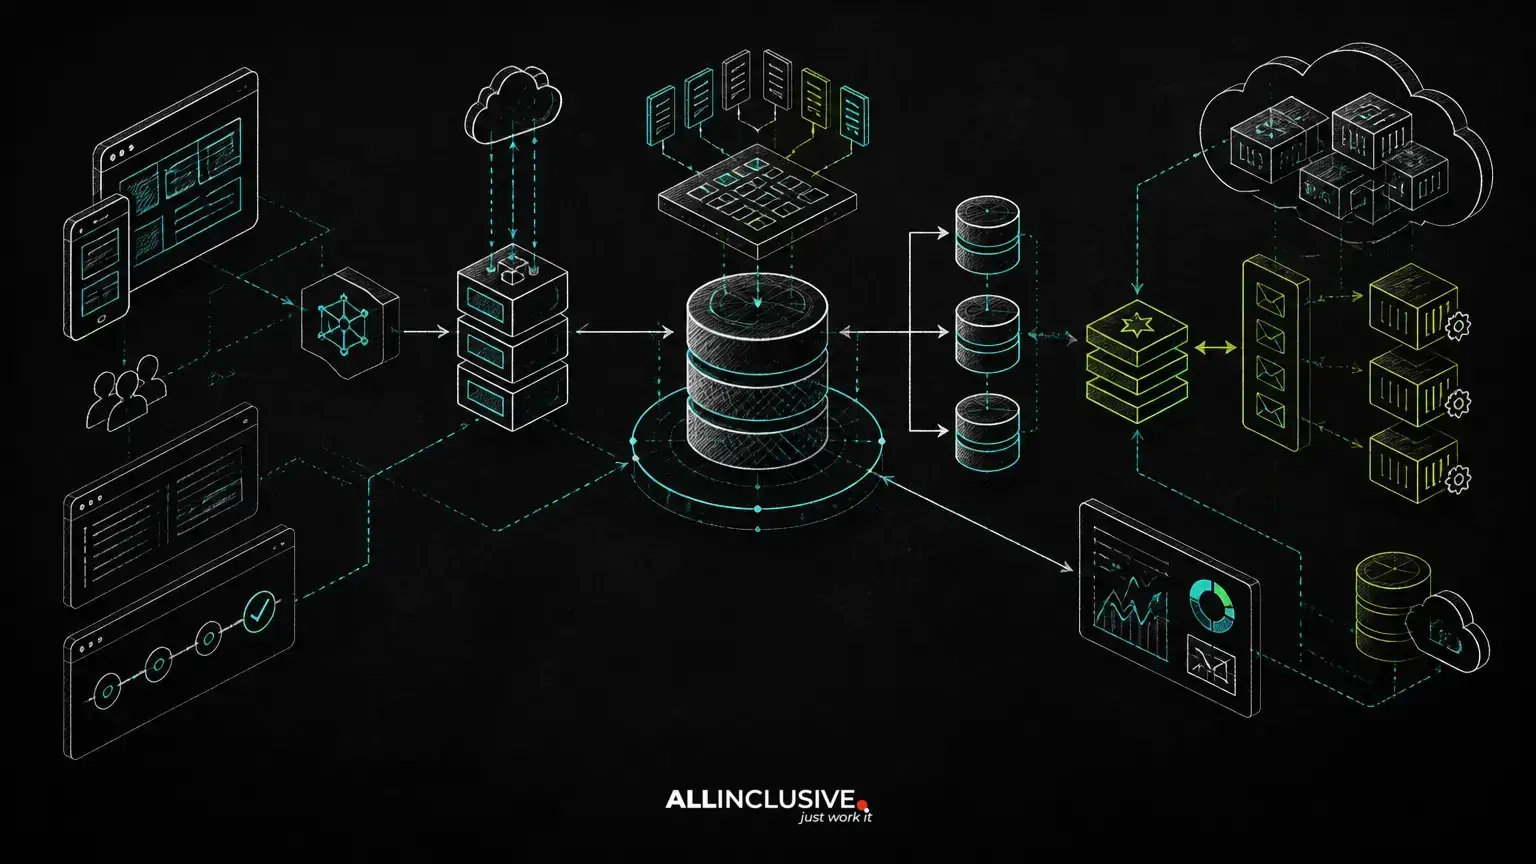
Many incidents that appear to be web-server problems originate in stateful systems or background processing.
Database visibility
Track connection-pool usage, query latency, transaction failures, lock or timeout errors, replication state where applicable, storage capacity and slow-query patterns. Application-level instrumentation should identify the operation that issued a problematic query, while database monitoring explains resource pressure underneath it.
Do not rely on average query duration alone. A small number of slow queries can affect a user-facing workflow even when the average looks acceptable. Pair latency data with request volume and error rates to distinguish an isolated query from a systemic capacity problem.
Redis and cache visibility
Redis may support caching, sessions, rate limiting, locks or queue infrastructure. Those roles have different failure consequences and should be observable separately where possible. Monitor latency, memory pressure, evictions, connection errors and command behavior relevant to the workload.
A cache hit-rate metric is useful only when its expected behavior is understood. A lower hit rate may indicate expired data, a deployment change, a key-design problem or simply a legitimate change in traffic. Monitor stale-data symptoms and fallback behavior as well as cache efficiency.
For more on choosing cache boundaries and handling freshness, see Redis caching strategy.
Queue and worker visibility
For asynchronous work, measure queue depth, oldest-job age, processing duration, retry counts, failure counts, worker concurrency and dead-letter or permanently failed jobs. Queue depth alone can be misleading: a queue may be growing slowly while the oldest job is already outside the required completion window.
Correlate jobs with the originating workflow when possible. Operators need to know whether a failed job affects a customer notification, report, import or financial side effect. Retry policies should be visible because repeated retries can amplify a downstream outage.
The article Queue Architecture for Web Applications covers retries, dead letters and backpressure that observability should make measurable.
Make deployment and infrastructure events visible
Many production incidents begin immediately after a code, configuration, schema or infrastructure change. Every deploy should emit an identifiable event containing the release version, environment, commit reference and deployment time. This allows responders to compare error and latency changes before and after release.
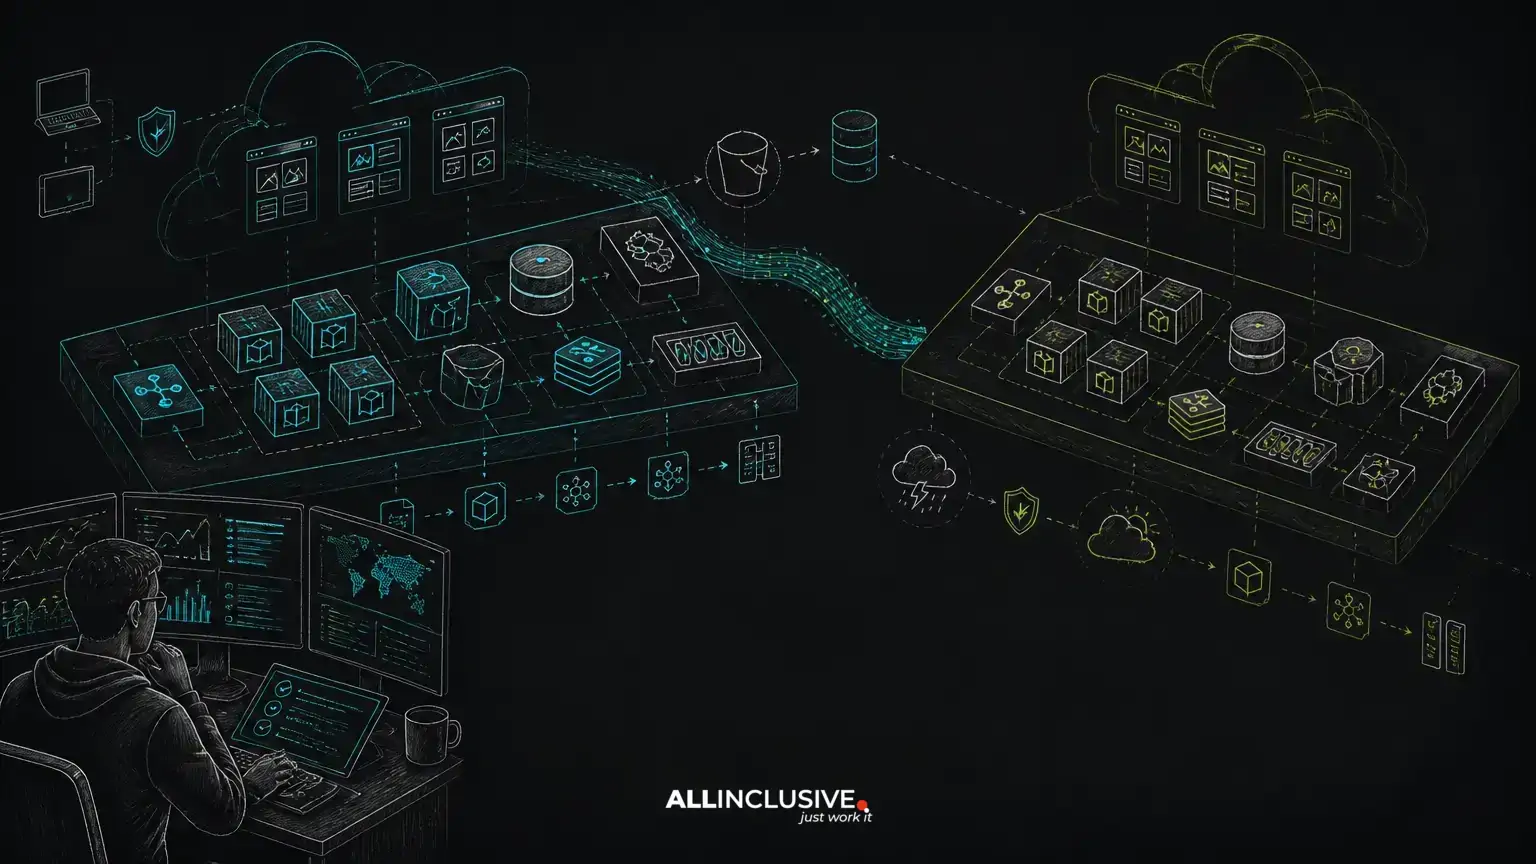
In Docker-based environments, monitor container restarts, health-check failures, resource throttling, memory pressure and image or configuration version. On AWS or another cloud platform, connect application signals with load balancer behavior, compute capacity, managed database health and network dependencies. The exact services may vary, but the principle is consistent: application telemetry must be queryable alongside infrastructure events.
Deployment observability is especially important for zero-downtime releases. A rollout can complete successfully while new instances fail to serve a particular route, workers use an incompatible job format, or old and new schema versions interact incorrectly. Release health checks should test meaningful application behavior, not only whether a process is listening on a port.
Related guidance on release sequencing is available in Zero-Downtime Deployment for Laravel and Python Applications.
Design alerts for action, not noise
An alert should indicate that someone needs to investigate or act. Alerting on every exception, container restart or short-lived latency spike trains teams to ignore notifications.
Prioritize symptoms tied to user impact and operational risk:
- Sustained elevated error rates on important routes.
- Latency that exceeds the workflow’s operational threshold.
- Queue age or backlog that threatens a completion commitment.
- Database connection exhaustion or repeated timeout failures.
- Storage, memory or capacity conditions that can prevent recovery.
- Repeated deployment health-check failures or rollback conditions.
Each alert should include a concise description, affected environment, relevant dashboard or query, likely dependencies and an initial action. Separate paging alerts from tickets or daily reports. A warning that is useful for capacity planning may not justify immediate interruption.
Use correlation IDs to reduce incident search time
A request or correlation ID provides a common reference across logs, traces and asynchronous operations. It should be generated at the edge when absent, propagated through application layers and included in responses or support tooling only when safe.
When a request creates a job, preserve a related identifier in the job metadata. The worker can then connect the asynchronous result to the initiating workflow without copying sensitive payloads into every log line. This is particularly useful when a user reports that an action appeared to succeed but its background processing did not complete.
Correlation does not replace careful data modeling. Do not use a single identifier as a substitute for recording operation type, tenant context, release version and dependency status. It is a join key, not a complete incident record.
Keep telemetry safe, affordable and useful
Observability data can contain sensitive information and can grow rapidly. Define collection and retention policies before enabling verbose production logging. Redact secrets at the source, restrict access to diagnostic systems, encrypt data according to the environment’s requirements and document who can review it.
Control cost and noise through sampling, aggregation and selective detail. Keep high-value error events and representative traces, while using metrics for broad trend analysis. During an incident, temporary diagnostic logging can be useful, but it should have an owner and an automatic or documented rollback plan.
Test the telemetry itself. A dashboard that has not been reviewed since an architecture change may show stale data or omit a new dependency. Include observability checks in CI/CD where practical: validate log structure, verify health endpoints, test alert queries and confirm that sensitive fields are not emitted.
Turn observability into an incident operating process
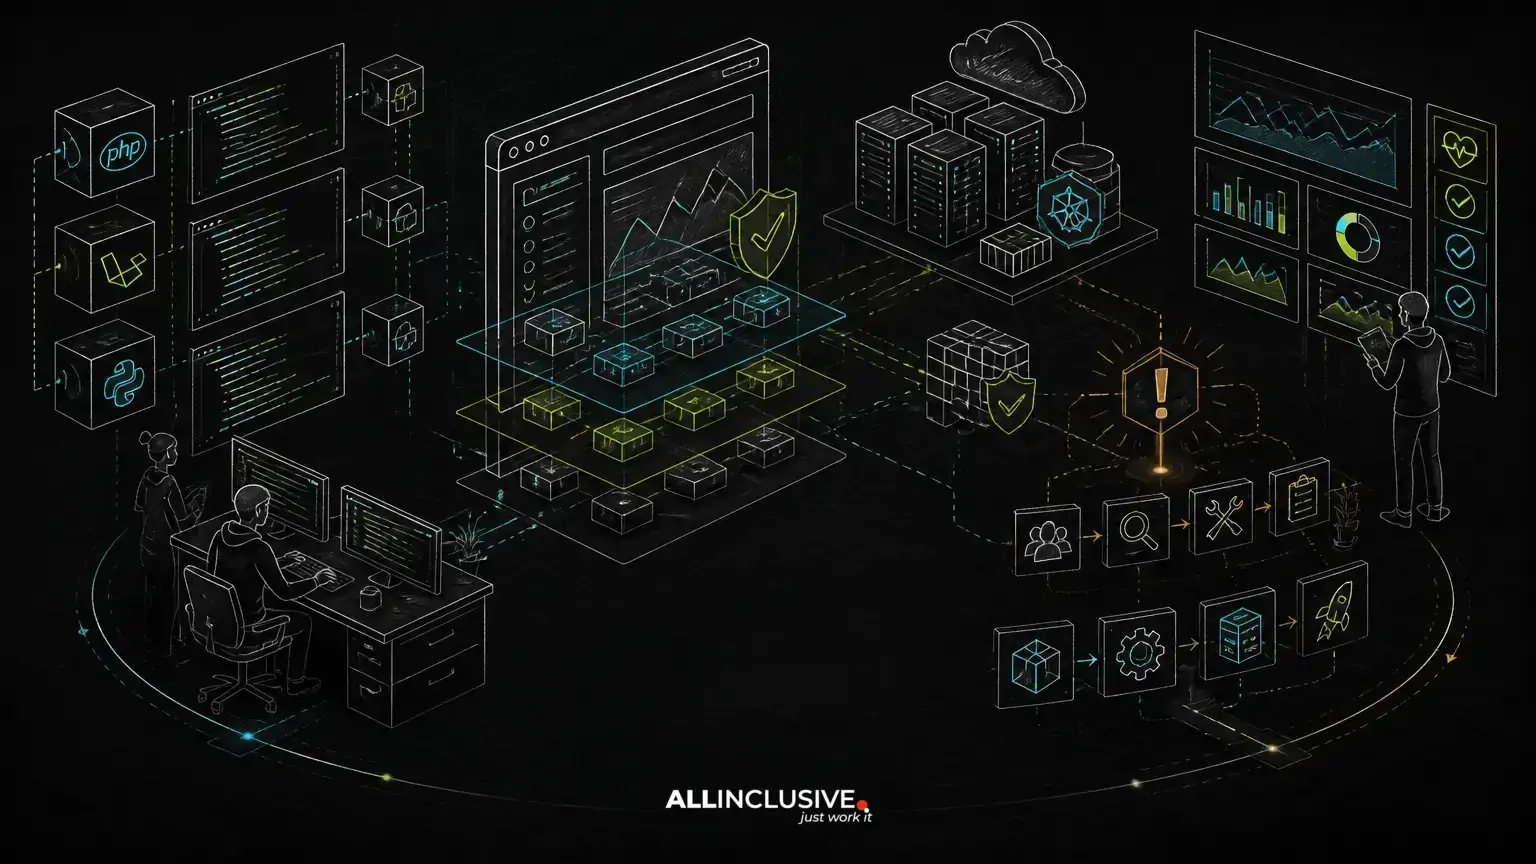
Tools do not resolve incidents without a process for using them. Define who owns first response, who can approve rollback or feature disablement, how customer impact is communicated and when an incident becomes a post-incident review.
After recovery, examine whether the available signals supported four questions: What happened? When did it begin? Which users or workflows were affected? Why did existing safeguards fail to prevent or limit it? Update dashboards, alerts, runbooks and tests based on the answers.
Observability should also inform capacity planning. Pair load-testing results with production metrics to understand how request volume, database usage, Redis behavior and worker throughput change as demand rises. The guide to load testing web applications provides a complementary way to validate these assumptions before a release.
A proportionate observability baseline for custom applications
A well-operated custom web application does not need every available telemetry feature on its first day. A sensible baseline includes structured application logs, request and error metrics, dependency health metrics, release markers, correlation IDs, queue monitoring where applicable, protected dashboards and documented response steps.
From there, add tracing and deeper instrumentation where the system’s architecture or incident history justifies it. A modular Laravel, PHP or Python application can gain substantial diagnostic value without being split into microservices. The right design makes dependencies and failure boundaries visible while keeping ownership and operations manageable.
For teams planning, stabilizing or extending a custom application, Allinclusive development services can be considered alongside the application’s architecture, delivery workflow and operational ownership. Ongoing monitoring, incident response and improvement work can also be structured through support and maintenance for web applications.