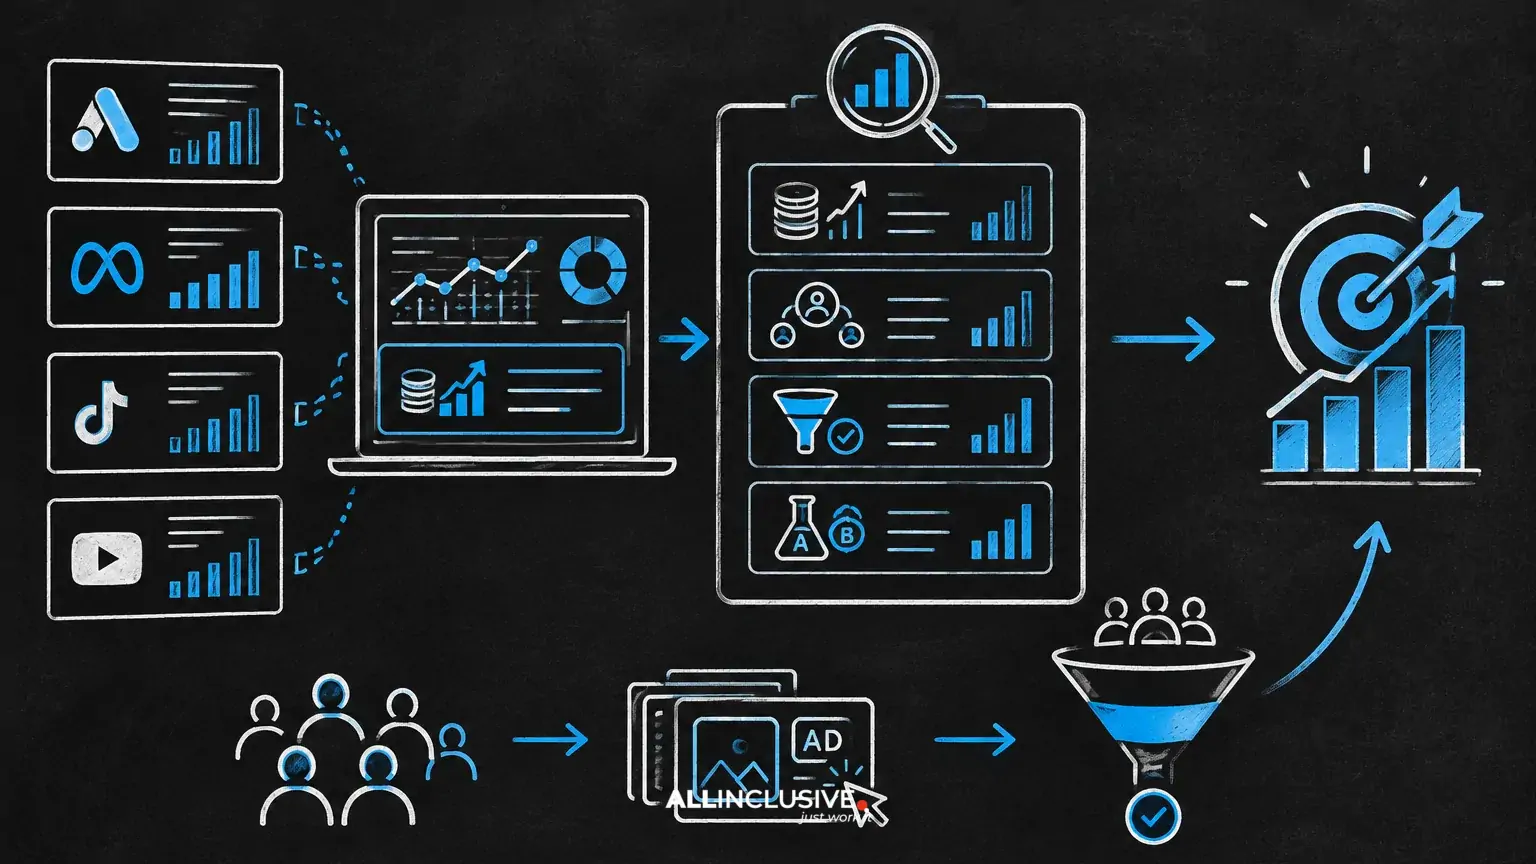
A useful paid media dashboard does more than display platform numbers. It connects investment to business outcomes, shows whether tracking can be trusted, and gives executives and operators enough context to make decisions without reading separate reports.
The right dashboard is not the one with the most charts. It is the one that answers a short list of operational and financial questions:
- How much did we spend, and what did that investment produce?
- Are campaigns pacing against plan?
- Are conversions real, qualified and moving toward revenue?
- Where is performance changing, and what action should follow?
- Which conclusions are reliable, and which depend on incomplete attribution?
This article outlines a measurement structure that separates executive reporting from campaign management while keeping both views connected.
What a paid media dashboard should do
A dashboard should support decisions, not simply automate data collection. Before choosing visualizations or connectors, define the decisions the dashboard must inform.
Executives typically need a concise view of investment, business outcomes, efficiency, forecast risk and major changes. Operators need more detail: delivery by channel, audience, creative, query or placement, conversion lag, tracking health and budget pacing.
These audiences can use the same underlying data model, but they should not receive the same page. Combining every metric into one screen usually creates noise and encourages users to optimize toward whatever number is easiest to move.
The core measurement layers
A strong dashboard usually has four layers. Keeping them distinct makes interpretation easier and helps prevent platform metrics from being confused with business results.
1. Investment and delivery
This layer describes what the media system delivered and what it cost. Typical fields include:
- Spend
- Impressions and reach, where available and meaningful for the buying objective
- Clicks or visits
- Click-through rate
- Cost per click or cost per thousand impressions
- Frequency, when audience exposure is relevant
- Budget, pacing and remaining planned investment
Delivery metrics are important, but they are not proof of business impact. A campaign can generate inexpensive traffic while producing weak leads, poor sales quality or no measurable incremental value.
2. Conversion activity
The second layer records the actions campaigns are credited with generating. Depending on the business, these may include purchases, qualified leads, booked meetings, applications, subscriptions or other defined milestones.
Do not place every conversion in one undifferentiated total. Label each conversion by event type, source of truth and stage. A form submission, marketing-qualified lead and closed-won opportunity are not interchangeable outcomes.
Useful fields include:
- Conversion volume by event and channel
- Cost per conversion
- Conversion rate
- New versus returning customers, where relevant
- Lead status or sales stage
- Conversion and sales lag
3. Revenue and value
The third layer connects media activity to financial outcomes. It may include revenue, gross profit, pipeline value, customer value or another approved business metric.
Revenue reporting should make its scope clear. For example, reported revenue might be transaction revenue associated with an attributed purchase, while pipeline value may be an estimate subject to later qualification. If the business uses different value definitions across channels, show those differences rather than presenting a false comparison.
Efficiency metrics may include:
- Return on ad spend
- Customer acquisition cost
- Cost per qualified opportunity
- Revenue per visitor or lead
- Contribution margin after media costs, when reliable margin data is available
ROAS is useful in the right context, but it should not be treated as a complete measurement system. For a deeper discussion, see Paid Media ROAS: Why Platform ROAS Is Not the Whole Story.
4. Measurement confidence
The final layer explains how much trust users should place in the numbers. Include notes or fields for attribution window, reporting lag, modeled or estimated values, missing cost data, conversion tracking changes, CRM reconciliation and known exclusions.
A dashboard without measurement context can create unwarranted precision. A small movement in attributed conversions may reflect a tracking change, delayed imports or a change in attribution rules rather than a genuine shift in demand.
Executive view: the small set of metrics that matters
An executive page should be deliberately limited. The objective is to show whether investment is producing acceptable business outcomes and where intervention may be needed.
A practical executive layout can include:
- Spend versus plan: show period-to-date spend, planned spend and projected end-of-period delivery.
- Primary business outcome: report the metric the organization actually manages toward, such as revenue, qualified pipeline or new customers.
- Efficiency: include the agreed efficiency measure, with its definition visible.
- Trend: compare against an appropriate prior period or plan, while accounting for seasonality and conversion lag.
- Channel or portfolio contribution: show how investment and outcomes are distributed, without implying that attributed credit equals incremental contribution.
- Risks and actions: identify material tracking issues, pacing problems, supply constraints or performance changes.
Every executive metric should have a definition. “Leads” could mean all submissions, validated leads or sales-accepted leads. “Revenue” could be platform-attributed, analytics-attributed or finance-confirmed. Ambiguous labels create more disagreement than a missing chart.
Operator view: metrics that support action
Operators need diagnostic detail, but detail should be organized around controllable levers. Useful breakdowns may include campaign, ad group or ad set, creative, audience, keyword or query, geography, device, landing page and conversion event.
Prioritize metrics that answer an action-oriented question:
- Budget: Is the campaign constrained, under-delivering or spending ahead of plan?
- Traffic quality: Are visits engaging with the intended experience?
- Conversion quality: Are leads progressing, or is the campaign generating low-value volume?
- Creative: Is a message losing efficiency, or is delivery simply shifting across variants?
- Landing page: Is the post-click experience limiting conversion or qualification?
- Data quality: Are events duplicated, missing, delayed or inconsistent with the source system?
Use tables for investigation and charts for trends. A sortable table with clearly defined fields is often more useful for optimization than a page of decorative visualizations.
How to handle attribution in the dashboard
Attribution is a reporting lens, not a complete causal explanation. Platforms, analytics tools and CRM systems may assign credit differently because they use different identifiers, windows, models and data availability.
Do not force these systems to agree. Instead, make the differences visible and assign each source an appropriate role:
- Ad platforms: useful for campaign delivery and in-platform optimization.
- Web analytics: useful for cross-channel path analysis under its configured rules.
- CRM or commerce data: useful for lead progression, sales outcomes and recognized revenue.
- Experiments or modeled analyses: useful when the question is incremental impact rather than attributed credit.
For implementation considerations around web analytics attribution, see GA4 Attribution for Paid Media: Models, Limitations and Reporting. For lead-generation businesses, Offline Conversion Tracking: Connecting Leads to Revenue covers the connection between media events and downstream outcomes.
A mature dashboard can show more than one perspective, but it should not average incompatible numbers into a single “truth” metric. Label the source, model and reporting window for every important outcome.
Metric definitions and data governance
Most dashboard failures are definition failures rather than visualization failures. Create a metric dictionary before building the report.
For each metric, document:
- Name and plain-language definition
- Business owner
- Source system
- Calculation logic
- Time zone and date basis
- Attribution window or reporting rule
- Refresh frequency and expected delay
- Known exclusions and caveats
Also establish naming conventions for campaigns, channels, markets, products and conversion events. Consistent taxonomy reduces manual cleanup and makes cross-channel comparisons more defensible.
Choosing reporting windows and comparisons
A dashboard can mislead when it compares periods with different levels of maturity. Recent clicks may not yet have generated leads or sales, especially in longer consideration cycles.
Use comparison periods that fit the buying cycle. Consider day-over-day views for pacing, week-over-week views for operational changes and longer periods for business outcomes with meaningful lag. Where conversion delay is material, annotate recent periods as incomplete rather than presenting them as final.
Comparisons should also account for budget changes, promotions, seasonality, inventory, pricing, sales capacity and tracking releases. A dashboard does not need to explain every fluctuation, but it should help users avoid treating every fluctuation as a media effect.
Building a reliable dashboard: a practical sequence
- Define the decisions. List the decisions executives and operators need to make, then map only the metrics required to support them.
- Choose the outcome hierarchy. Identify the primary business outcome, supporting funnel stages and diagnostic delivery metrics.
- Inventory data sources. Document ad platforms, analytics, CRM, commerce, finance and offline conversion inputs.
- Reconcile key fields. Check spend, conversions, revenue and dates against source systems before designing polished views.
- Set definitions and ownership. Assign an owner to each metric and document calculation rules.
- Build executive and operator views separately. Use shared logic, but different levels of detail and different default filters.
- Add quality controls. Flag missing data, unusual volume changes, delayed imports and tracking modifications.
- Test with real decisions. Ask users to identify what action they would take from the report. Revise any chart that produces confusion or no decision.
Common dashboard mistakes
Optimizing for volume without quality
More conversions are not necessarily better if the event is weakly connected to revenue. Pair volume with downstream quality and value.
Mixing sources without labeling them
Combining platform conversions, analytics conversions and CRM outcomes into one total can create double counting and false precision.
Using averages that hide distribution
Blended cost per conversion can conceal large differences by campaign, product, market or customer type. Provide the relevant breakdown when decisions depend on it.
Reporting trends without context
Charts should identify material changes, but notes should explain known causes such as budget shifts, tracking releases, promotions or data delays.
Making the dashboard a replacement for analysis
A dashboard is a monitoring and decision-support layer. It does not replace controlled tests, customer research, financial reconciliation or deeper attribution analysis.
What “good” looks like
A good paid media dashboard is understandable without a guided tour, precise about definitions and honest about uncertainty. It lets an executive see whether investment is on plan and producing the intended business outcome. It lets an operator locate a performance change, assess its likely cause and choose a next step.
Start with a narrow set of trusted metrics. Add complexity only when it supports a real decision. If the organization needs to estimate causal impact beyond attributed reporting, consider methods such as incrementality testing or marketing mix modeling rather than adding more platform columns. The broader paid media discipline depends on both effective execution and measurement that is clear about what it can—and cannot—prove.